
The EUR/USD pair is trading within a narrow range as markets await a series of important data releases, most notably:
US inflation figures (PCE)
European consumer confidence data.
The current tension reflects the absence of a strong trend, pending clarity on monetary policies for both sides.
EUR/USD : Technical Indicator Analysis
Moving Averages
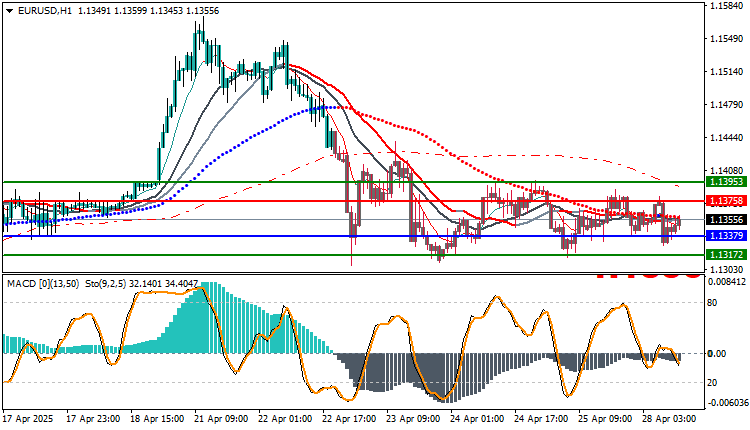
The price is moving below the 50- and 100-period moving averages.
The short-term moving averages are sloping down
MACD
below the zero line with moderately negative momentum.
No clear bullish crossover yet
Stochastic:
Moving down from the mid-range area (50–35).
Indicates that negative pressure remains.
Bullish Scenario (currently weak):
A break of 1.1375 is a preliminary condition for resuming the rise towards 1.1395.
Only a close above 1.1400 would change the overall trend.
Bearish Scenario
A break of 1.1337 could accelerate the decline towards 1.1317.
A break of 1.1317 opens the way to 1.1280.A break of 1.1332 would confirm the continuation of the downside correction.
Trading strategies based on Buy/Sell levels
| In case of buying | in case of selling | EURUSD |
| 1.13758 | 1.13379 | Entry point |
| First resistance: 1.13953 | First support 1.13172 | Target Point 1 (TP1) |
| Second resistance 1.14156 | Second support 1.12972 | Target Point 2 (TP2) |
| 1.13379 | 1.13758 | Stop Loss (SL) |
The EUR/USD pair is moving within a bearish consolidation range amidst a clear weakening in buying momentum.
As long as the price remains below 1.1375, selling remains preferable with each weak rebound, monitoring a break of 1.1337 for a stronger sell entry.
Selling is recommended upon a break of 1.1337 with a stop loss above 1.1375, with an initial target of 1.1317 and then 1.1280.


