
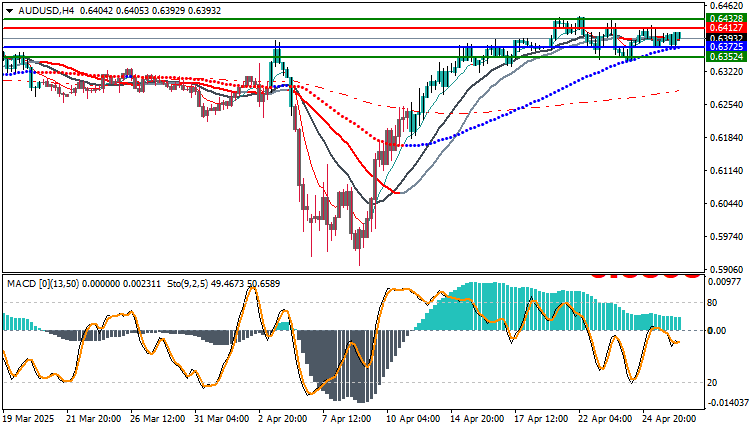
Technical Analysis for AUD/USD : The Australian dollar continues to maintain its momentum against the US dollar, supported by rising prices for industrial metals such as copper, and continued positive expectations for the Chinese economy (Australia’s largest trading partner).
The US dollar is trading cautiously ahead of US GDP data, increasing volatility.
Technical Indicator Analysis
Moving Averages
The price is above the 50-, 100-, and 200-period moving averages.
The averages support the uptrend, but they have begun to consolidate.
MACD
Shows a slight decline in positive momentum.
No negative crossover yet, but buying power has weakened.
Stochastic
Retreating from intermediate levels (50-60).
Indicates a sideways correction rather than a bearish reversal.
Possible Scenarios
Bullish Scenario
A breakout of 0.6417 and then 0.6428 confirms the resumption of the rise towards 0.6462.
Bearish Scenario
A breakout of 0.6375 pushes the price to test 0.6352.
A breakout of 0.6352 weakens the bullish structure
Trading strategies based on Buy/Sell levels
| In case of buying | in case of selling | AUDUSD |
| 0.64127 | 0.63725 | Entry point |
| First resistance: 0.64328 | First support: 0.63524 | Target Point 1 (TP1) |
| Second resistance 0.64552 | Second support 0.63302 | Target Point 2 (TP2) |
| 0.63725 | 0.64127 | Stop Loss (SL) |
The AUD/USD pair is moving within a positive consolidation range above strong support levels, with a decisive breakout above 0.6428 anticipated.
Consolidation above 0.6375 maintains the buying bias, but watch for any reversals if the upside breakout fails.
Buying on a break of 0.6417 is recommended, or buying back from a strong rebound at 0.6375 with a stop loss below 0.6350.


