
EURUSD Technical Analysis: The EUR/USD pair continues to trade in a bearish trend, as it trades within a relatively narrow range. The pair recorded its highest trading level so far at 1.0404 and its lowest at 1.0389, while it is currently trading near the 1.0392 level. These movements indicate a state of volatility within a sideways range, with a general tendency towards the downside.
EURUSD Technical Analysis: Technical Analysis
Technically, the pair shows that prices are trading below the main moving averages, which contributes to confirming the bearish trend in the medium and long term. The MACD indicator also indicates a negative trend, as negative signals appear on the chart, which reinforces expectations of continued downward pressure on the pair in the near term.
Economic Influences:
The market is currently awaiting the release of the weekly unemployment claims report in the United States, which may have a significant impact on market movement. If the data comes out lower than expected, this may strengthen the US dollar and increase pressure on the euro. On the other hand, if the data is greater than expected, the dollar may witness some weakness, leading to a reversal in the pair’s movement.
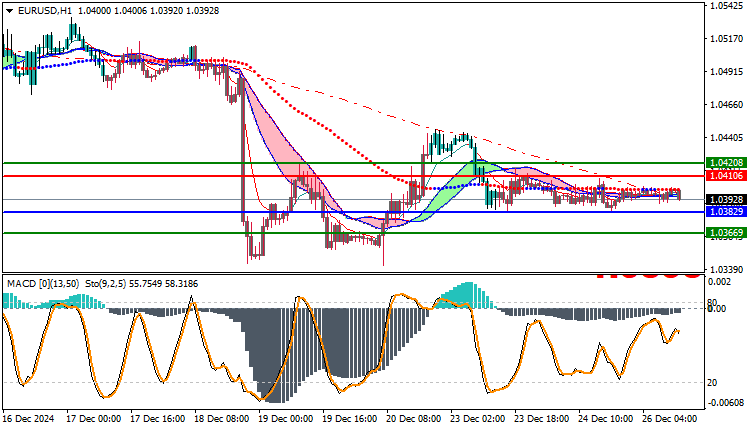
Trading strategies based on Buy/Sell levels
| EURUSD | In case of buying | in case of selling |
| Entry point | 1.0410 | 1.0382 |
| Target Point 1 (TP1) | First resistance: 1.0420 | First support: 1.0366 |
| Target Point 2 (TP2) | Second resistance: .0433 | Second support: 1.0340 |
| Stop Loss (SL) | 1.0382 | 1.0410 |
Based on the current technical analysis and the expected economic factors, the overall trend for the EUR/USD pair appears to be bearish, with prices fluctuating within a narrow range. If trading continues below the moving averages, the negative movement is likely to remain dominant. However, US economic data, especially unemployment claims, will continue to be an influential factor in determining the future price direction.


