
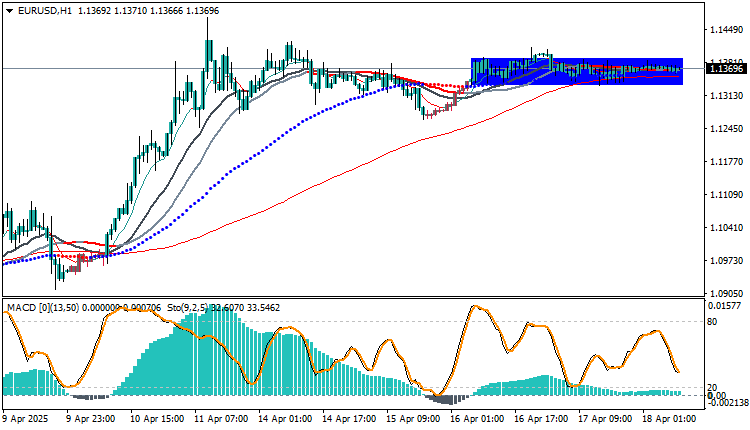
EURUSD Technical Analysis : The pair is currently trading in a narrow sideways range between approximately 1.1330 and 1.1390. It is not recommended to enter trades at this time unless there is a clear breakout above or below this range. Short traders may look for opportunities within the range, but caution is advised.
- Price Action:
- The price was in a strong uptrend until midday on April 15.
- After that, the price began moving sideways within a clear sideways range (marked by the blue rectangle) from April 16 to April 18.
- Moving Averages:
- There are a set of moving averages (in different colors: red, blue, gray, and black).
- The red average (appears to be the 200 EMA) is below the price, indicating long-term support.
- The price is currently trading around the shorter moving averages, reflecting volatility and uncertainty in the direction.
- MACD Indicator:
- There are no strong signals currently; The indicator is somewhat flat, reinforcing the notion of volatility and a lack of clear momentum.
- Stochastic Oscillator:
- The indicator is in the middle zone (approximately 33), neither overbought nor oversold, which also reinforces the notion of sideways volatility.A break of 1.1260 will temporarily disrupt the upward momentum
Trading strategies based on Buy/Sell levels
| In case of buying | in case of selling | EURUSD |
| 1.13900 | 1.13300 | Entry point |
| First resistance: 1.14200 | First support: 1.13000 | Target Point 1 (TP1) |
| Second resistance: 1.14503 | Second support: 1.12700 | Target Point 2 (TP2) |
| 1.13300 | 1.13900 | Stop Loss (SL) |
The trend remains strongly bullish, supported by technical buying momentum from indicators, and price stem EUR/USD pair is undergoing a horizontal consolidation phase after a strong uptrend.
The trend remains bullish, but any negative break above the 1.1304 area could trigger a downward acceleration towards 1.1260.
From a professional perspective, it is recommended to wait for a clear break above 1.1355 to confirm the continuation of the uptrend, or wait for a technical rebound from the support area to exploit it for low-risk long positions. Ability above 1.1392 maintains the positive scenario.
It is preferable to exploit pullbacks as re-entry zones with the general trend.


