
The EURUSD pair saw a strong rally last week, supported by a weaker US dollar. However, momentum began to gradually decline as markets approached influential US data in the coming sessions, particularly GDP and consumer confidence data. So far, there are no clear signals from the European Central Bank supporting further upside in the short term, increasing the likelihood of a technical correction.
EURUSD Technical Indicator Analysis
Moving Averages
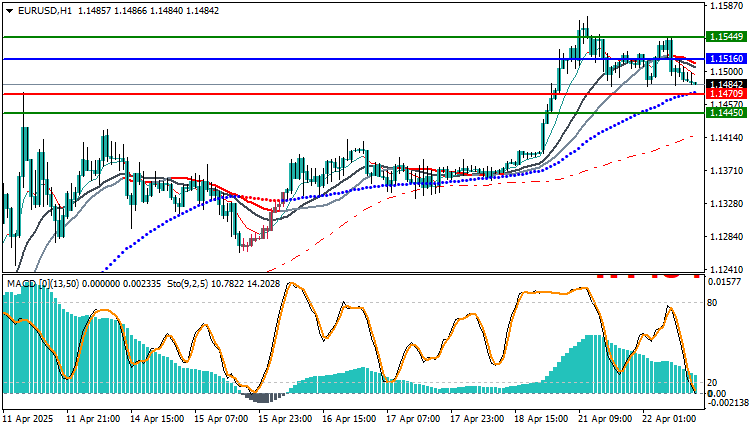
The price has begun to break the 50-day moving average.
The averages have begun to converge and slope downward.
MACD
A clear negative crossover. Negative bars are increasing in volume and momentum.
Stochastic
Approaching the oversold zone (around 20).
Indicates a possible slight rebound, but the trend remains weak.
Expected Scenarios
Possible Scenarios
Bearish Scenario
A break of 1.1469 pushes the price towards 1.1450 and then 1.1430.This scenario is supported by the bearish momentum of the MACD.
Bullish Scenario
A rebound from 1.1469 could retest 1.1498 and then 1.1529.
However, a break of 1.1529 is required to signal a resumption of the upside.
Trading strategies based on Buy/Sell levels
| In case of buying | in case of selling | EURUSD |
| 1.15160 | 1.14709 | Entry point |
| First resistance: 1.15449 | First support: 1.14450 | Target Point 1 (TP1) |
| Second resistance 1.15734 | Second support 1.14203 | Target Point 2 (TP2) |
| 1.14709 | 1.15160 | Stop Loss (SL) |
The EUR/USD pair is undergoing a technical correction phase after a strong rally. With clear signs of weakening momentum, any rebound will be temporary unless 1.1529 is breached.
The best opportunities currently lie in monitoring a break of the 1.1469 support level to exploit a decline towards 1.1450 – 1.1430.
Selling is recommended after a break of 1.1469, with a stop loss above 1.1529


