
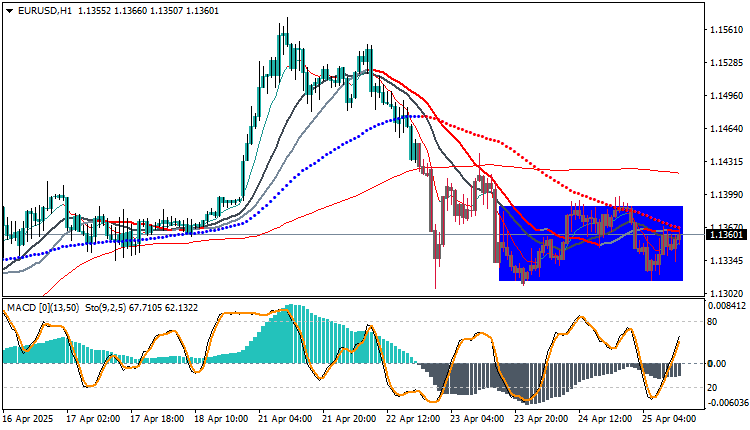
The EURUSD Technical Analysis is moving in a narrow sideways range during the last week of April, following a strong downward trend that began around the 1.1540 high. The H1 chart shows a decline in momentum with moving averages overlapping, reflecting investor anticipation as they await new economic catalysts.
EURUSD Technical Analysis: Market Overview
- The pair is trading sideways within a limited support and resistance zone between 1.1330 and 1.1385 (marked by the blue rectangle).
- The price is below the major moving averages (50, 100, and 200), indicating continued selling pressure in the near term.
- There are no strong reversal signals yet, but momentum indicators are showing signs of a temporary upward correction.
Technical Indicator Analysis
- Moving Averages: The price is below all moving averages (20, 50, and 100), indicating a continuation of the downtrend.
- MACD: A recent positive crossover, with bars beginning to shift into positive territory, indicates a potential temporary upside move.
- Stochastic: A bullish crossover is emerging within the oversold zone, reinforcing the possibility of an upward rebound.
- Sideways movement range: Clear between 1.1330 and 1.1385, with a breakout of either extreme providing a strong trading signal.
Possible Scenarios
Bullish Scenario
: 1.1395 – 1.1405: First short-term resistance, a momentum test zone after the breakout.
: 1.1420: Near the 100-hour moving average, an important moving average.
: 1.1435: A previous small high formed on April 23, a psychological level and temporary resistance.
: 1.1450: An important technical horizontal resistance level.
Bearish Scenario
: 1.1315 – 1.1300: Initial horizontal support, representing areas of previous price rebounds.
1.1285: The April 16 retracement zone, used as technical support.
1.1270: An intermediate support level, where some temporary buying may occur.
1.1255: A previous local low from April.
Trading strategies based on Buy/Sell levels
| In case of buying | in case of selling | EURUSD |
| 1.13840 | 1.13170 | Entry point |
| First resistance: 1.14160 | First support: 1.12870 | Target Point 1 (TP1) |
| Second resistance: 1.14460 | Second support: 1.12570 | Target Point 2 (TP2) |
| 1.13170 | 1.13840 | Stop Loss (SL) |
The pair is trading within a narrow range, awaiting a clear breakout in one of the two directions. The overall trend remains downward, but momentum indicators point to a possible temporary upward correction. We recommend waiting for a clear break above 1.1385 or 1.1330 to confirm the next trend. This week’s US economic data will play a crucial role in driving the market. EURUSD: Continued trading above 1.1030 enhances the chances of targeting the 1.1125–1.1150 levels, while any break of this support could lead to a corrective decline towards 1.0980.


