
XAUUSD Technical Analysis
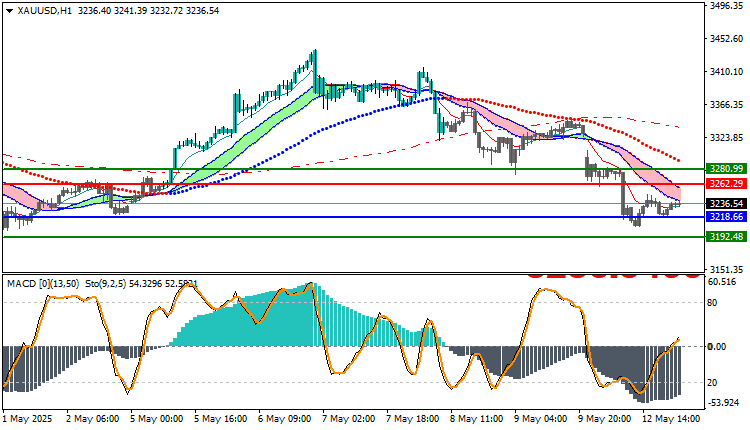
Gold is currently trading at $3,236.54 per ounce, and the market appears to be in a bearish phase. Price action suggests that gold is experiencing downward momentum, as it is trading below several key moving average (MA) crossovers. This indicates a lack of bullish support and further strengthens the bearish outlook.
The MACD (Moving Average Convergence Divergence) indicator also confirms the negative trend, showing that the momentum is still in favor of the sellers. The MACD is below the signal line, indicating that the price is likely to continue its downward movement unless there is a significant shift in market sentiment.
For those considering a short position, the strategy would be to enter a sell order while waiting for the price to decline towards the $3,218.66 per ounce level. This price point could provide an entry opportunity for a continuation of the bearish trend. Traders should monitor this level closely, as it is expected to act as an initial support zone.
Further downward movement may bring the price to the next significant support level around $3,192.48 per ounce, where traders can look to take profits. This target aligns with the continuation of the bearish trend. However, exercise caution, as the market may experience short-term retracements. Placing a stop-loss order is essential to manage risk effectively.
The suggested stop-loss level for this trade is at $3,262.29 per ounce. If the price rises and surpasses this level, it would invalidate the bearish outlook, and traders would need to reconsider their positions.
XAUUSD Technical Analysis : On the Other Hand
On the other hand, if the $3262.29 buy zone is broken, the price may head to the $3280.99 zone.
Resistance and Support Levels
- Second Resistance: 3240.12
- First Resistance: 3238.20
- Pivot Level: 3236.74
- First Support: 3234.55
- Second Support: 3232.41


