
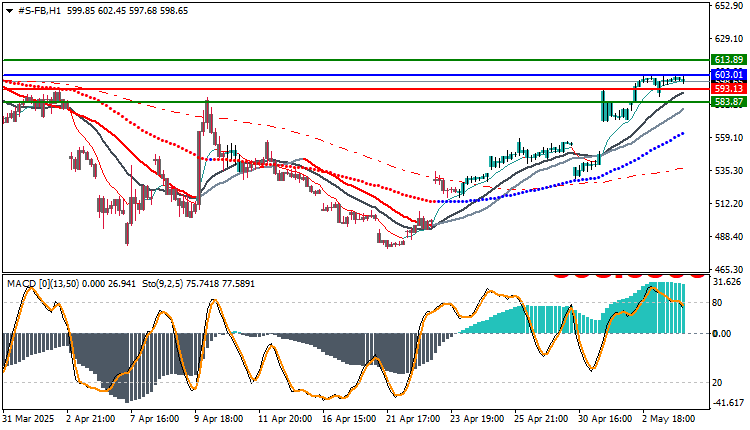
Facebook Technical forecast. Meta stock (symbol: #S-FB) has recently experienced remarkable performance in the US stock market, supported by a clear technical recovery on the H1 timeframe. After a prolonged period of decline, the stock rebounded strongly in late April and early May, sparking traders’ interest in potential buying opportunities. In this analysis, we review the stock’s performance from a technical perspective using moving averages, the MACD, and stochastic oscillator, identifying support and resistance zones, and presenting the following action scenarios.
Facebook technical forecast: Technical overview:
- General trend: Upward in the short term, supported by moving averages.
- Momentum: Strong and positive currently, with signs of nearing important resistance levels.
- Current price: Trading near $600, within a critical resistance range that may determine its next direction.
Technical Indicators Analysis:
- Moving Averages: The price is above the 20-, 50-, and 100-period moving averages, reflecting a stable upward trend.
- MACD: The indicator is in a positive zone, with growing green bars, but may soon face overbought conditions.
- Stochastic: Near the overbought zone (above 75), indicating a possible temporary correction or a slowdown in momentum.
Bullish Scenario:
- If the price stabilizes above 598.65 and breaks the resistance at 602.45, we may see an extension towards the next technical target at 609.25.
- A break of this level supports the short-term target of 613.85.
Bearish Scenario:
- If the price fails to break 602.45 and breaks the support at 593.13, we may see a downward corrective movement towards 583.87, a pivotal support area.
Trading strategies based on Buy/Sell levels
| Facebook Stock | In case of buying | in case of selling |
| Entry point | 603.01 | 693.13 |
| Target Point 1 (TP1) | First resistance: 613.89 | First support: 582.46 |
| Target Point 2 (TP2) | Second resistance: 622.00 | Second support: 574.00 |
| Stop Loss (SL) | 693.13 | 603.01 |
Meta (Facebook) stock is currently reflecting a promising upward trend, supported by strong technical momentum and positive short-term indicators. However, its proximity to critical resistance areas requires caution. It is preferable to wait for a bullish confirmation signal through a break of 602.45 to complete the trend, or a break of 593.13 to confirm a correction. It is essential for traders to follow this week’s US employment data, which could change the technical equation abruptly. Moving cautiously with flexible stop-loss orders is key at this stage.
Facebook technical forecast : Impactful Economic Data This Week:
- Among the most significant potential influencers are the US Nonfarm Payrolls (NFP) data scheduled for Friday, May 3, which could affect risk appetite in the overall stock market.
- Also, statements by US Federal Reserve officials regarding interest rates and inflation.


