
USOIL Technical Analysis: Today, the oil market is witnessing a weak upward movement, as the pair recorded a high of $73.03 and a low of $71.83. At the moment, the market is trading at $71.97 per barrel. This movement indicates a state of narrow oscillation between the resistance level at $73.00 and the support level at $71.80, with a weak tendency towards the upside.
USOIL Technical Analysis: Technical Analysis of Prices
In the context of current trading, the market appears below the moving averages indicators that reflect the strength of the prevailing trend, indicating that the upside trend is still weak at the moment. The MACD indicator also reflects weak positive signals, which reinforces the idea that the upward momentum may remain limited.
Future Outlook:
If the price continues to trade below the moving averages, we may witness continued oscillation around the current levels, with an attempt to regain the upward momentum if the $72.78 level is clearly breached. On the other hand, if the price declines below the $71.29 level, lower support areas may be touched, which may limit the strength of the current uptrend.
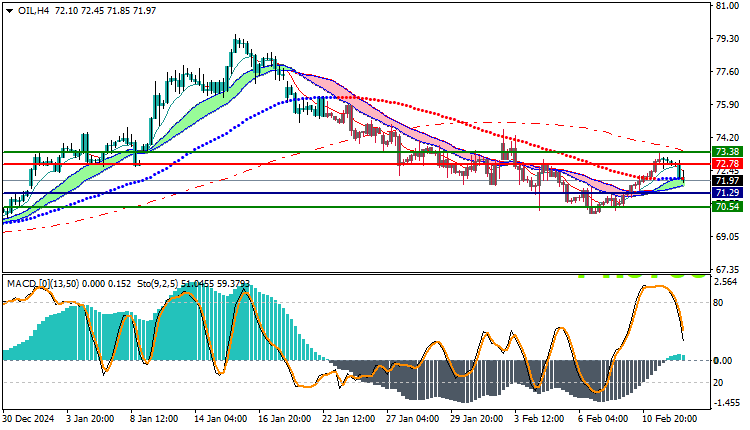
Trading strategies based on Buy/Sell level
| USOIL | In case of buying | in case of selling |
| Entry point | 72.78 | 71.29 |
| Target Point 1 (TP1) | First resistance: 73.38 | First support: 70.54 |
| Target Point 2 (TP2) | Second resistance: 73.80 | Second support: 70.05 |
| Stop Loss (SL) | 71.29 | 72.78 |
Technical analysis shows that oil is experiencing a period of volatility under the influence of a weak upward trend.
and technical indicators reflect a calm movement that may continue in the coming period. It is necessary to monitor the main support and resistance levels and wait for the emergence of any strong signals confirming the future direction of the market.


