
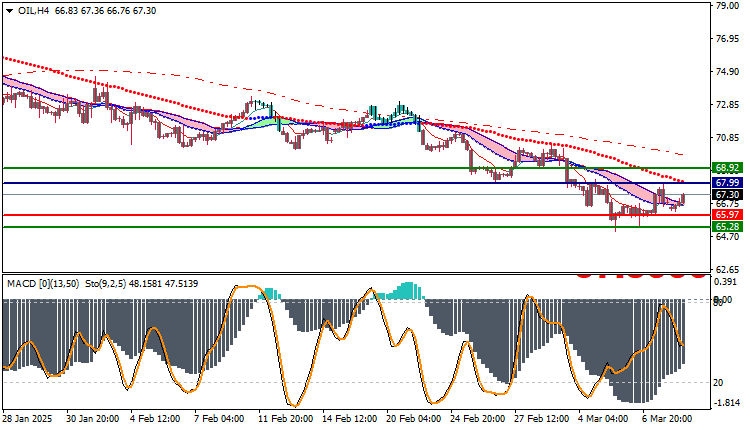
USOIL Technical Analysis: Today, oil is trading in a downward trend, as it recorded a high trading price so far at 67.36 and a low at 66.49. At the moment, oil is trading at 67.30, reflecting that the downward momentum continues, despite some signals that may indicate a weakness in the downside strength.
USOIL Technical Analysis: Trading Price Analysis
The current oil price movement shows trading below the moving averages, which reinforces the support for the downward trend in the short term. This reflects the strength of the selling pressure in the market at the moment, with oil remaining below these averages that act as resistance levels.
Technical Analysis:
Technically, the MACD indicator shows a negative trend, as the MACD line continues to trade below the signal line, indicating the continuation of the downward momentum. However, it is important to note that there is a weakness in the downside strength, as the gap between the MACD lines and the signal line is not widening significantly, which may indicate a decline in selling momentum and the market’s ability to correct or consolidate in the near future.
Trading Outlook:
Based on the current technical analysis, oil is expected to continue its downtrend in the short-term.
especially if it continues to trade below the moving averages. If the selling pressure continues, oil may target the nearby support levels at 65.97. If this support is broken, the market may witness further declines. On the other hand, if the market shows some bounce or upward correction, it will be important to follow oil to surpass the moving averages to return to an upward path.
Trading strategies based on Buy/Sell level
| USOIL | In case of buying | in case of selling |
| Entry point | 67.99 | 65.97 |
| Target Point 1 (TP1) | First resistance: 68.92 | First support: 65.28 |
| Target Point 2 (TP2) | Second resistance: 69.69 | Second support: 64.70 |
| Stop Loss (SL) | 65.97 | 67.99 |
The analysis indicates that oil is facing a bearish momentum supported by the price trading below the moving averages and the negative MACD. However, there is a weakness in the downside strength.
which may indicate a possible correction or rebound in the near future. Support and resistance levels should be carefully monitored.
as any changes in momentum may lead to a reversal in the trend.


