
USOil Technical Analysis: The oil market is currently witnessing an upward trend, as prices continue to rise despite a slight decline. So far, oil prices have recorded a high of $67.96 per barrel and a low of $66.61 per barrel. This price range indicates a slight corrective movement within the ongoing upward trend.
USOIL Technical Analysis: Technical Analysis
- General Trend:
Upward trend: The general trend of oil continues to rise, despite the slight decline in prices recently. This decline is a natural correction within the upward trend.
- Technical Indicators:
Moving Averages: Prices indicate that they are trading above the moving average levels, which provides additional support and reinforces the positive outlook for the upward trend.
MACD Indicator: The MACD indicator shows a positive trend, but also indicates a weakness in the buying power. This weakness may be an indication of increasing selling pressure or the possibility of a deeper correction before the upward trend continues.
USOIL Technical Analysis: Trading Strategy for Today
- Buy Strategy: If trading continues above the moving averages, buying opportunities can be considered, especially if prices break the current decline and start moving upwards again. It is preferable to set entry points close to support levels ($66.61 per barrel) with stop loss orders in anticipation of any unexpected movements.
- Sell Strategy: If prices witness a continuous decline and break below support levels, there may be an opportunity to sell oil, with stop loss orders placed at resistance levels to reduce risks.
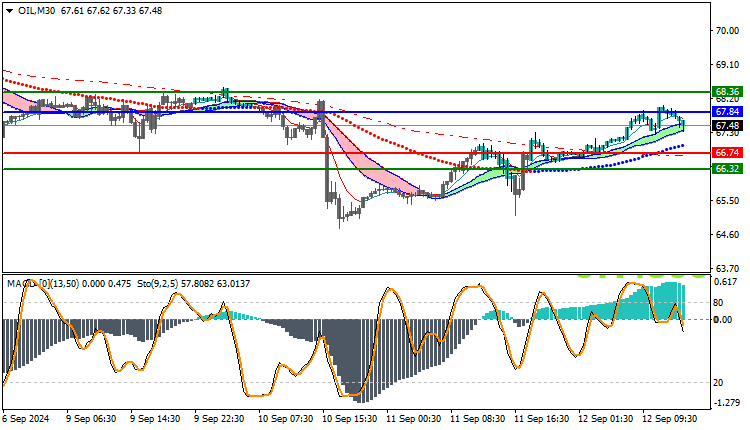
Trading strategies based on Buy/Sell level
| USOIL | In case of buying | in case of selling |
| Entry point | 67.84 | 66.74 |
| Target Point 1 (TP1) | First resistance: 68.36 | First support: 66.32 |
| Target Point 2 (TP2) | Second resistance: 68.88 | Second support: 66.00 |
| Stop Loss (SL) | 66.74 | 67.84 |
Current technical analysis suggests that oil is still in a long-term uptrend, albeit with a slight correction. Oil is trading above the moving averages, which reinforces the positive outlook, but the weakness of the MACD indicator requires caution. It is advisable to follow market developments carefully and determine entry and exit points based on price action and support and resistance indicators.


