
USOil Technical Analysis: The oil market continues its downward trend, with the negative trend dominating the price movement significantly. Despite some attempts to weaken the downward trend in the past few days, the general trend is still leaning down.
USOIL Technical Analysis: Technical Analysis
- Price levels:
o High price for the day: $68.47 per barrel
o Low price for the day: $66.95 per barrel
o Current price: $67.31 per barrel
After oil rose to $68.47, the market witnessed a rapid correction that led to a drop in the price to its lowest level at $66.95. This fluctuation reflects an important test of the strength of oil in continuing the decline.
- Moving Average Indicators: The current price movement indicates that oil is trading below the main moving averages, which supports the negative view of the general trend. Trading below these averages enhances the strength of the downward trend and indicates the market’s inability to achieve a noticeable recovery at the present time.
- MACD Indicator: The MACD indicator shows clear signs of a negative trend, as the MACD line is trading below the signal line, which reinforces the hypothesis of a continued decline. This signal confirms the strength of the current downtrend and supports our expectations of an extension of this trend.
USOIL Technical Analysis: Trading Opportunities
- Selling Opportunities: With trading continuing below the moving averages and negative signals from the MACD indicator, selling opportunities remain the most attractive. Any short-term bounces can be exploited to sell at nearby resistance levels or near current prices.
- Buying Opportunities: Although the general trend is down, any upward corrective movement may provide short-term buying opportunities. Prices should be monitored around $66.95 levels, as a pause in the decline may indicate a temporary buying opportunity, provided that there are strong support signals.
USOIL Technical Analysis: Daily Trading Strategy
- Bearish Strategy: Sell positions can be opened at resistance levels near $67.50 – $68.00, with close stop-loss points set in anticipation of any upward corrective movement.
- Bullish strategy: In case of unexpected positive signals, one can consider opening short-term buy positions around the $66.95 level, with stop loss points placed below this level to protect the portfolio.
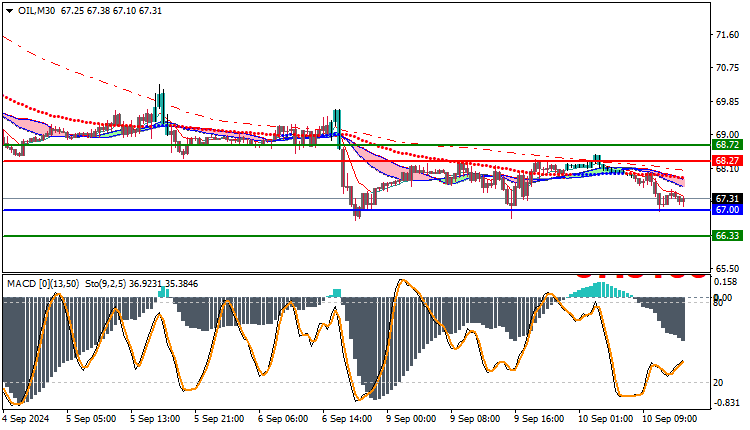
Trading strategies based on Buy/Sell level
| USOIL | In case of buying | in case of selling |
| Entry point | 68.27 | 67.00 |
| Target Point 1 (TP1) | First resistance: 68.72 | First support: 66.33 |
| Target Point 2 (TP2) | Second resistance: 69.00 | Second support: 65.80 |
| Stop Loss (SL) | 67.00 | 68.27 |
Technical analysis suggests that the overall trend of oil remains bearish, with the market movement dominated by a negative trend, with confirmations from the moving averages and MACD indicators. Traders should focus on taking advantage of potential downside moves, while watching for any signs of a potential trend reversal.


