
USOIL Technical Analysis: The oil market is currently showing a clear downtrend on the chart, although there are signs of weak selling power. Oil recorded a high of $69.65 per barrel today and a low of $68.83 per barrel, while it is currently trading at $69.29 per barrel. The noticeable volatility in prices reflects the inability of oil to achieve a strong breakout in the downtrend or regain upward momentum.
USOIL Technical Analysis: Technical Analysis of Oil
- Price levels:
o High of the day: $69.65 per barrel
o Low of the day: $68.83 per barrel
o Current trading price: $69.29 per barrel
- Technical indicators:
o Moving averages: Prices are currently trading in a fluctuating range around the moving average levels, indicating a lack of a clear trend. Trading above and below the averages reflects the instability of the trend and indicates market indecision.
o MACD Indicator: The MACD indicator is showing signs of weakening selling power, as the lines are starting to converge, which could be an indication of a potential trend reversal. This could indicate a potential build-up of strength in preparation for a return to the downside or a trend reversal.
USOIL Technical Analysis: Today’s Recommendation
Based on the current technical analysis, it is recommended to focus on trading in a limited range. Selling strategies can be considered when prices rise near resistance levels, while paying attention to the possibility of trend reversals. Monitoring the MACD signal and oscillations around the moving averages will be crucial in determining the optimal point to enter or exit the market.
USOIL Technical Analysis: Today’s Expected Trading Pattern
Prices are expected to continue to fluctuate within the current downtrend range, with potential trend changes based on MACD movements and the buying or selling strength in the market. It is advisable to closely monitor price movements and look for clear signals before making any trading decisions.
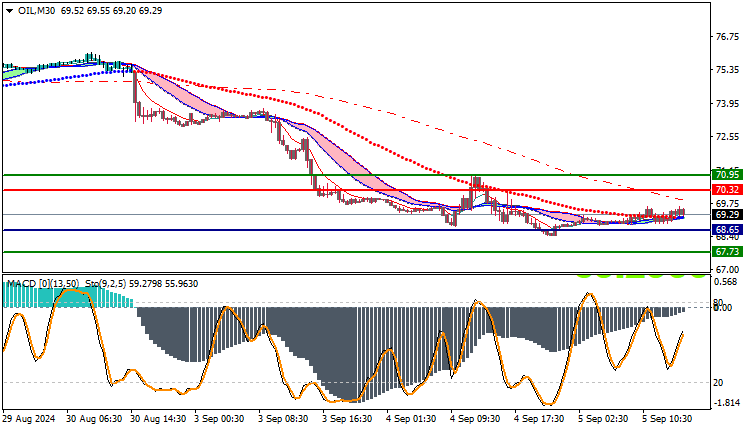
Trading strategies based on Buy/Sell levels
| USOIL | In case of buying | in case of selling |
| Entry point | 70.32 | 68.65 |
| Target Point 1 (TP1) | First resistance: 70.95 | First support: 67.73 |
| Target Point 2 (TP2) | Second resistance: 71.40 | Second support: 67.09 |
| Stop Loss (SL) | 68.65 | 70.32 |
The current technical analysis reflects a state of instability in the crude oil market, with the downtrend continuing but accompanied by weak selling power. It is advisable to focus on range trading strategies while monitoring technical indicators for signs of a potential reversal. Careful assessment of MACD changes and price movements around moving averages will be key to accurately determining the future trend.


