
USOil Technical Analysis: Today, oil prices witnessed remarkable movements, as the price reached a high of $75.57 per barrel, while recording a low of $73.51. The general trend reflects a downward trend, as oil is trading below the major moving averages.
USOIL Technical Analysis: General Trend and Potential Movements
General Trend: Current technical analysis indicates that oil is in a downward trend, as the price is trading below the major moving averages, reinforcing the general negative trend in the market.
Upside: If the price manages to rebound and trade above the nearby resistance levels at $75.57, this may indicate the possibility of a temporary upward correction. In this case, buying opportunities can be considered upon any sustained breakout of the major levels.
Downside: Continuing the downward trend may lead to further decline towards lower support levels. If the price continues to decline below the current support level at $73.51, the market may witness further decline towards lower support levels.
USOIL Technical Analysis: Using Technical Indicators
Moving Averages:
- Current Situation: Oil is trading below the moving averages, which reinforces the signal of a continuation of the downtrend. The price being below these averages indicates a weakening of the upward momentum and confirms the negative trend.
MACD Indicator:
- Current Situation: MACD is showing a negative trend, as it reflects a negative crossover between the fast line and the slow line.
- Signals: The negative trend on MACD indicates that the downtrend may continue. If the indicator turns positive, this may indicate a potential reversal in the trend, but this requires confirmation through other signals such as a breakout of resistance levels.
Recommendations:
- Buying Strategy: It is preferable to consider buying oil if the price is able to rebound and exceed the high of the day at $75.57, with positive signals from technical indicators confirmed.
- Selling Strategy: Selling may be considered if the price continues to decline below the support level at $73.51, with the negative trend confirmed by MACD and any additional negative signals followed.
Best Trading Opportunities:
- Buying opportunities: May be available when key resistance levels are broken and a bullish reversal is confirmed. Watch for positive momentum indicators and trade above moving averages.
- Selling opportunities: They are strongest when the price trades below key support levels, with downside support from technical indicators such as MACD.
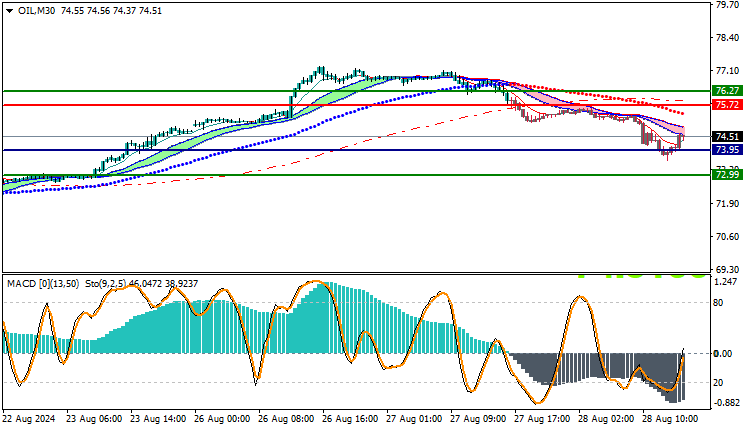
Trading strategies based on Buy/Sell level
| USOIL | In case of buying | in case of selling |
| Entry point | 75.72 | 73.95 |
| Target Point 1 (TP1) | First resistance: 76.27 | First support: 72.99 |
| Target Point 2 (TP2) | Second resistance: 76.50 | Second support: 72.20 |
| Stop Loss (SL) | 73.95 | 75.72 |
Oil price is currently showing a bearish trend, trading below the moving averages and the MACD indicator supporting the downtrend. Market developments should be closely monitored for any potential signals of a trend change. The current strategy remains to focus on selling opportunities in the downtrend, while keeping a close eye on any changes in market signals to identify potential buying opportunities.


