
USOIL Technical Analysis today
The current price of oil in the global market is $63.07 per barrel. Technical analysis suggests that oil is in a downtrend, with prices trading below key moving average crossovers. However, despite this downtrend, the MACD (Moving Average Convergence Divergence) indicator signals a potential positive trend, implying that there could be upward momentum in the near future.
Given this outlook, traders are advised to consider buying oil with an expectation that the price will rise toward the next resistance level of $63.96 per barrel. This price point serves as an initial target for short-term profit-taking. If the market continues its upward movement, the next key target would be $65.02 per barrel. This price level represents a higher resistance zone.
and traders can aim to secure profits around this level, based on technical analysis and market conditions.
For risk management, it is crucial to place a stop-loss order at $61.51 per barrel. This stop-loss level helps protect against significant downside risk in case the market moves against the position. By setting this stop-loss point, traders limit their potential loss while allowing for profit opportunities if the price reaches the targeted resistance levels.
In conclusion, the current market presents a buying opportunity with a well-defined risk-reward strategy. Traders should look for a potential price rise toward $63.96 and $65.02 while keeping risk management in mind by placing a stop-loss at $61.51. Monitoring the MACD indicator will also help gauge the ongoing trend for potential adjustments to the trading strategy.
USOIL Technical Analysis: On the other hand,
if the sell zone at $61.51 per barrel is broken, an additional support level at $60.65 per barrel could be targeted.
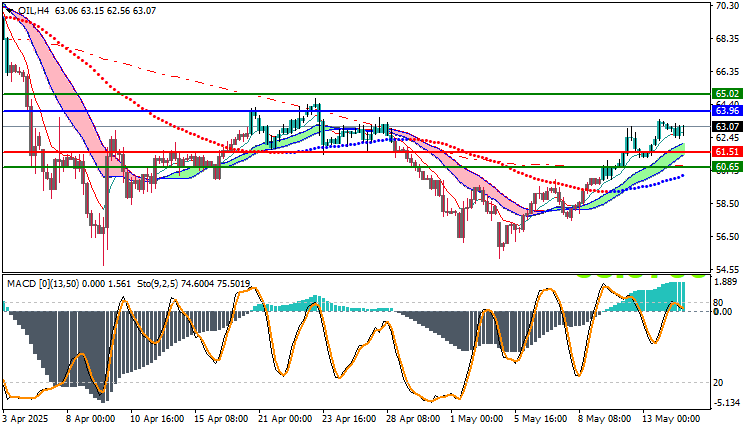
Resistance and Support Levels
- Second Resistance: 63.66
- First Resistance: 63.43
- Pivot Level: 63.19
- First Support: 62.96
- Second Support: 62.72


