
USOIL Technical Analysis Today
Today’s oil price in the global market is trading at $56.86 per barrel, and according to current technical analysis, the trend indicates a bearish outlook. The price is currently trading below key moving averages, signaling a downward trend in the short term. Additionally, the MACD (Moving Average Convergence Divergence) indicator is showing a negative momentum, further suggesting that the price is likely to continue declining.
Given the current technical setup, it may be an opportune time to consider selling, with the expectation that the price will fall further. A reasonable target for this trade would be $55.95 per barrel, where the price may find short-term support.
To manage risk effectively, it’s crucial to implement a stop-loss order to protect against adverse price movements. A suggested stop-loss point would be at $58.76 per barrel, just above recent resistance levels. This stop-loss placement helps to limit potential losses if the price unexpectedly reverses and moves higher.
especially in the event of market volatility or unexpected geopolitical developments.
In conclusion, the technical indicators suggest a bearish outlook for oil prices in the near term. By selling at current levels and targeting lower price points, traders can position themselves to take advantage of the downward trend. However, risk management is essential.
and placing a stop-loss order at $58.76 ensures that potential losses are contained in case of an upward price reversal.
USOIL Technical Analysis: On the other hand,
if the buy zone at $58.76 per barrel is broken, an additional support level at $59.98 per barrel could be targeted.
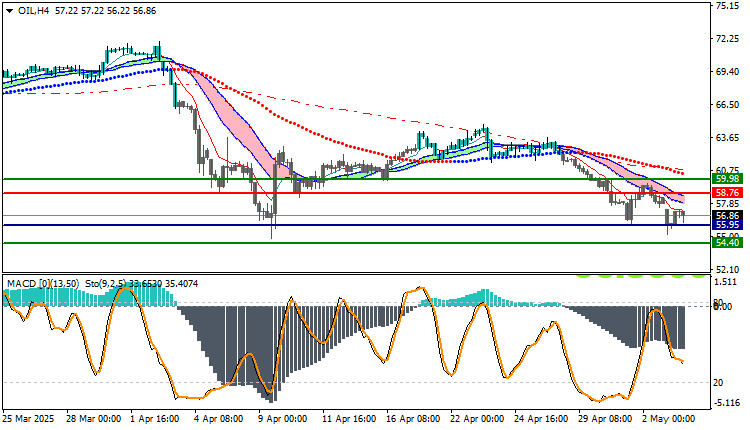
Resistance and Support Levels
- Second Resistance: 57.27
- First Resistance: 57.08
- Pivot Level: 56.87
- First Support: 56.68
- Second Support: 56.47


