
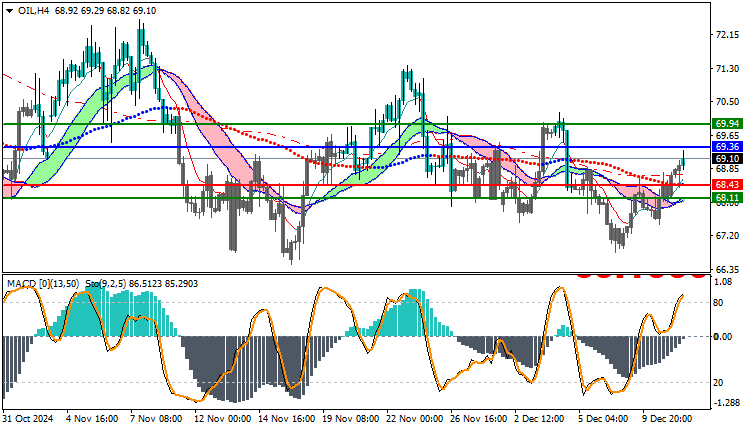
USOil Technical Analysis: Oil is trading in an upward trend today, as it recorded its highest trading price so far at $69.29 per barrel and its lowest price at $68.80, while it is currently trading at $69.10. Oil is showing positive movement, as it is trading above the moving averages indicators, which reinforces the positive outlook for the upward trend.
USOIL Technical Analysis: General Market Trend
Oil is showing strength in the upward trend today, as trading continues above the moving averages, which supports the continuation of the upward momentum. This indicates the dominance of buyers in the market, and indicates that prices may continue to move higher if the support of economic factors continues.
Technical Trading Indicators Analysis
- MACD Indicator: The MACD indicator indicates the end of the negative trend, reflecting a positive shift in momentum. This signal supports the possibility of the continuation of the upward momentum and opens the door to further increases if this movement continues.
- Analysis using moving averages: Trading prices above the major moving averages indicates that the market is heading towards more upward strength, as this trading reflects strong buying pressure that reinforces the positive outlook for oil in the near future.
Trading strategies based on Buy/Sell level
| USOIL | In case of buying | in case of selling |
| Entry point | 69.36 | 68.43 |
| Target Point 1 (TP1) | First resistance: 69.94 | First support: 68.11 |
| Target Point 2 (TP2) | Second resistance: 70.40 | Second support: 67.80 |
| Stop Loss (SL) | 68.43 | 69.36 |
Oil is showing a strong bullish trend today, supported by prices trading above moving averages and a positive MACD signal. The end of the negative trend enhances the positive opportunities for oil, opening the way for further gains in the near future. If the current momentum continues, oil could witness new breakouts to higher levels.


