
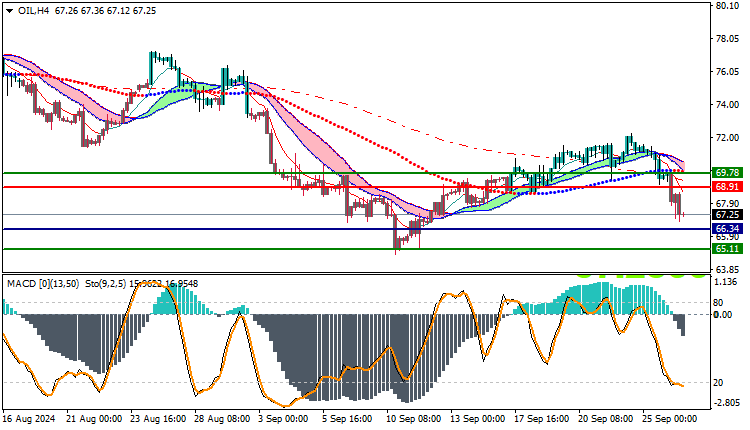
USOil Technical Analysis: The oil market is witnessing a noticeable decline, as it is currently trading in a downward trend. The price has fallen from its highest level today at $69.84 per barrel to its lowest level at $66.83, and is currently trading at $67.25 per barrel.
USOIL Technical Analysis Technical Analysis:
The moving averages indicate that prices are trading below them, which strengthens the downward trend. The MACD indicator also shows signs of the beginning of the seller’s strength, which reflects the expected negative trend.
USOIL Technical Analysis Expectations during the day:
- In the event of an increase: If oil is able to exceed the $67.50 level, we may witness an increase towards the resistance levels at $68.00 and $69.00.
- In the event of a decrease: If oil breaks the $66.83 level, with confirmation from the MACD indicator, we may see a decline targeting the support levels at $66.00 and $65.50.
Trading strategies based on Buy/Sell level
| USOIL | In case of buying | in case of selling |
| Entry point | 68.91 | 66.34 |
| Target Point 1 (TP1) | First resistance: 69.78 | First support: 65.11 |
| Target Point 2 (TP2) | Second resistance: 70.50 | Second support: 64.10 |
| Stop Loss (SL) | 66.34 | 68.91 |
Technical indicators point to a strong downtrend in the oil market. It is advisable to closely monitor price action to determine optimal entry and exit points, while paying attention to fundamental factors that may affect the market.


