
USOIL Technical Analysis: Today, oil is trading in a downtrend, recording a high of 66.71 and a low of 65.60. Currently, oil is trading at 66.37, reflecting fluctuations within a narrow range, but with a tendency towards the downside.
USOIL Technical Analysis: Technical Analysis
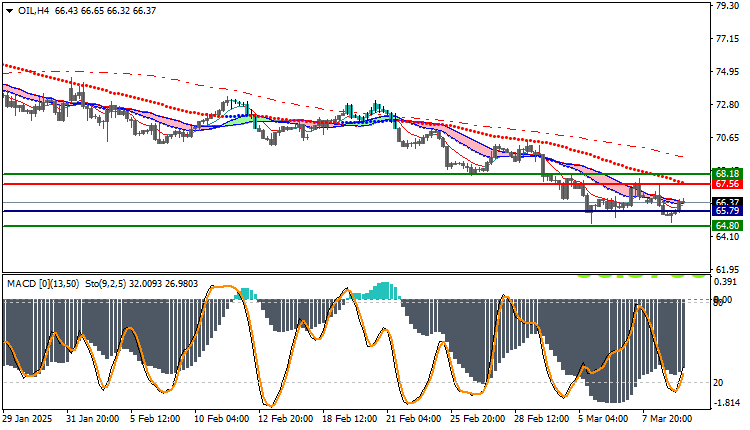
Technically, oil shows that prices are trading below the main moving averages, indicating that the downtrend is currently controlling the market. Prices remaining below the moving averages enhances the possibility of the downward movement continuing in the coming period.
Regarding the MACD indicator, the indicator indicates a negative trend, reflecting the weakness of positive momentum and confirming the downward trend. This signal supports the idea that selling pressures may continue to control the market in the near future.
Outlook:
If oil continues to trade below the moving averages, it could target nearby support levels at 65.79, with the possibility of heading towards lower support levels such as 64.80 if the downward momentum continues. On the other hand, if a sudden upward correction occurs, the 67.56 level will be the first resistance to watch.
Trading strategies based on Buy/Sell level
| USOIL | In case of buying | in case of selling |
| Entry point | 67.56 | 65.79 |
| Target Point 1 (TP1) | First resistance: 68.18 | First support: 64.80 |
| Target Point 2 (TP2) | Second resistance: 68.70 | Second support: 64.10 |
| Stop Loss (SL) | 65.79 | 67.56 |
The technical outlook for oil remains bearish at the moment, with prices continuing to trade below the moving averages and the MACD showing a negative trend. Traders are advised to watch for any signs of a decline in the bearish momentum or the beginning of an upward correction before making any trading decisions.


