
USOIL Technical Analysis: Today, oil continues its downtrend, recording its highest trading price at $68.07, while recording its lowest price at $67.27. At the moment, oil is trading at $67.32, reflecting the continuation of negative pressure on prices.
USOIL Technical Analysis: Technical Analysis
By analyzing the current price action, we notice that oil is trading below the moving averages, indicating a strong downtrend. This technical signal supports the hypothesis that the market is currently experiencing selling pressure. In addition, the MACD indicator is showing negative signals, reinforcing the idea that the downward momentum is still controlling the price action.
Future Outlook:
Since oil is trading below the moving averages, expectations indicate the possibility of continuing the decline towards lower support levels if negative factors continue to affect the market. If the $66.38 level is broken, it may open the way for further declines. Conversely, in the event of an upward correction, oil will need to break through key resistance levels to start a trend reversal.
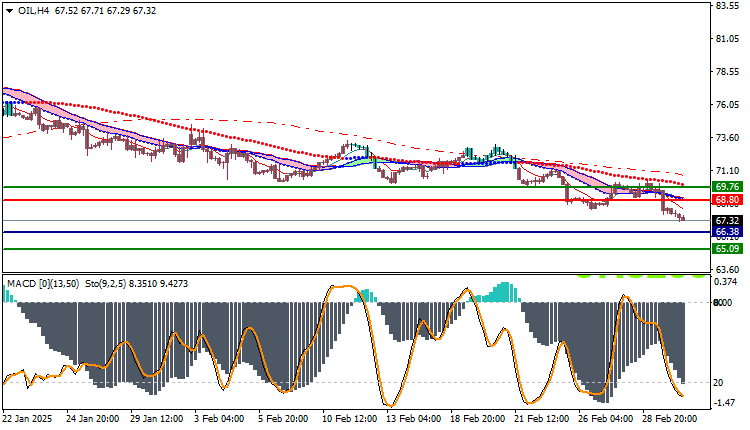
Trading strategies based on Buy/Sell level
| USOIL | In case of buying | in case of selling |
| Entry point | 68.80 | 66.38 |
| Target Point 1 (TP1) | First resistance: 69.76 | First support: 65.09 |
| Target Point 2 (TP2) | Second resistance: 70.20 | Second support: 64.50 |
| Stop Loss (SL) | 66.38 | 68.80 |
Oil is trading in a bearish trend, supported by negative signals from technical indicators. The market remains under selling pressure, and prices are likely to continue the downtrend if they continue trading below the moving averages. Traders are advised to monitor key support and resistance levels and take precautions in case of any trend changes.


