
USOIL Technical Analysis: Today, oil is trading in a downtrend, with the highest price of oil for the day at 71.19 and the lowest at 70.62, and is currently trading at 71.14. Technical analysis indicates that the market is reflecting downward pressures, despite some fluctuations within the specified range.
USOIL Technical Analysis: Price Analysis
Oil is currently trading below the moving averages, which indicates that the general trend is down. Trading below these averages is usually considered a sign of weak upward momentum and the market’s preference for a downward trend. This indicates that there is strong resistance to attempts to rise in prices, which increases the likelihood of continued downward pressure in the coming times.
Technical Analysis
Moving Averages: The moving averages show that oil is trading below these levels, which indicates that the general trend is still down in the short term. If the price continues to trade below the moving averages, this enhances the chances of continuing the decline and testing lower support levels in the near future.
MACD Analysis: MACD is showing a negative trend, reflecting weak bullish momentum and a bearish market bias. A negative MACD signal is a confirmation of continued selling pressure, which increases the likelihood of a downtrend continuing at the moment.
Trading Outlook:
Based on technical analysis, oil is expected to continue its downtrend in the short term.
with the price trading below the moving averages and a negative MACD signal. Oil may face further selling pressure if it breaks through current support levels, with a potential test of lower support levels.
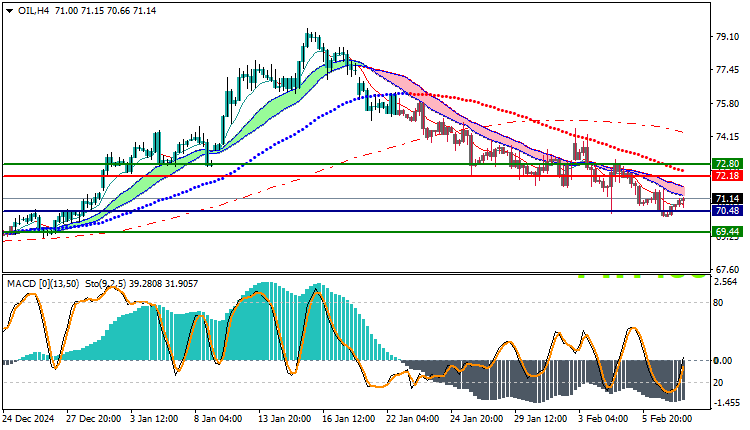
Trading strategies based on Buy/Sell level
| USOIL | In case of buying | in case of selling |
| Entry point | 72.18 | 70.48 |
| Target Point 1 (TP1) | First resistance: 72.80 | First support: 69.44 |
| Target Point 2 (TP2) | Second resistance: 73.30 | Second support: 69.00 |
| Stop Loss (SL) | 70.48 | 72.18 |
Oil appears to be trading in a bearish trend supported by technical analysis.
with the price trading below the moving averages as well as negative signals from the MACD indicator. If this bearish momentum continues, we could see further price declines. It is important to keep an eye on key support levels to identify potential trading opportunities and identify points where the trend may change.


