
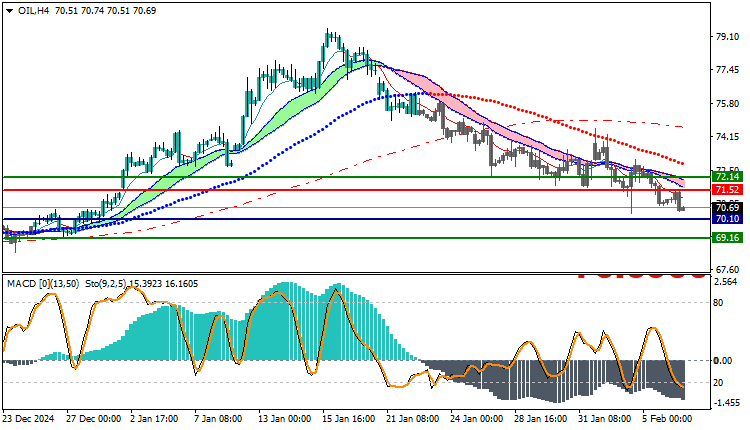
USOIL Technical Analysis: Today, oil is trading in a downtrend, as it recorded its highest price so far at $71.52, while it recorded its lowest price at $70.39, and is currently trading at $70.69. The market is showing clear selling pressure on prices, reflecting a weakness in the upward trend with increasing chances of a continued decline.
USOIL Technical Analysis: General Trend Analysis
Today, oil is showing a downtrend, as prices are trading below the moving averages, which reinforces the negative scenario and indicates continued selling pressure. The current fluctuation between the high and low levels reflects a state of weakness in the upward momentum, which weakens the chances of any recovery in prices in the near future.
Technical Analysis:
- Moving Averages: Prices are currently trading below the short and medium moving averages, which directs the market towards a downward trend. Moving below these averages indicates a weakness in the upward momentum, and the possibility of testing more support levels.
- MACD Indicator: MACD indicator indicates a negative trend with the MACD line crossing below the signal line, which reinforces the idea of a continued decline and increases the possibility of a corrective movement in the short term.
Best trading scenario:
- If the selling pressure continues, we may witness an additional downward movement towards nearby support levels such as $70.10 or even $71.52.
However, in the event of an upward rebound and prices returning to trade above $71.52, the market may head to test the next resistance levels, but this case requires a strong momentum of buying.
Trading strategies based on Buy/Sell level
| USOIL | In case of buying | in case of selling |
| Entry point | 71.52 | 70.10 |
| Target Point 1 (TP1) | First resistance: 72.14 | First support: 71.52 |
| Target Point 2 (TP2) | Second resistance: 72.60 | Second support: 71.05 |
| Stop Loss (SL) | 70.10 | 71.52 |
Oil is showing strong signs of weakness with prices trading below the major moving averages.
and the MACD confirming the negative trend. The most likely scenario is a continuation of the downtrend with a possible breakout of current support levels. Therefore, it is advisable to monitor the market closely, with clear downside targets in case the selling pressure continues.


