
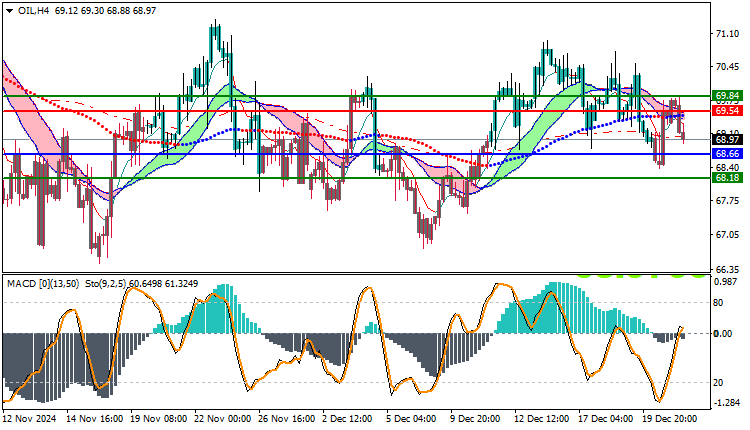
USOil Technical Analysis: Oil is trading in a downtrend today, recording its highest price today at $69.84 per barrel, then declining to reach its lowest level so far at $68.78. Currently, oil is trading near the $68.97 level, reflecting the continued selling pressure on the market and weak upward momentum.
USOIL Technical Analysis: Price Analysis
Prices are currently trading below the moving averages, which indicates the presence of strong resistance preventing oil from resuming its rise. Trading below these averages reflects that the general trend of the market is downward, and increases the likelihood of this trend continuing in the near term, especially in light of the weak purchasing power.
Technical Analysis:
Moving Averages:
Moving averages indicate that prices are trading below them, which reinforces the idea that the downtrend will continue as long as the market faces strong resistance at these levels. Trading below these averages reflects the absence of upward momentum.
which increases the likelihood of the downtrend continuing in the coming period.
MACD Indicator Analysis:
The MACD indicator is indicating a bearish trend, as the indicator shows a bearish crossover between the MACD line and the signal line, reflecting a weakening of the bullish momentum and increasing selling pressure. This shift in the trend indicates the possibility of continuing the decline towards lower levels if the current conditions persist.
Trading Outlook:
In light of the current technical analysis, the bearish trend is expected to remain dominant in the market in the coming hours. If oil continues to trade below resistance levels such as $69.00 – $69.50, the decline may extend towards lower support levels such as $68.00 or even $67.50. In case of any shift in momentum, it will be necessary to monitor the $69.84 level for a breakout as an indicator of a possible recovery.
Trading strategies based on Buy/Sell level
| USOIL | In case of buying | in case of selling |
| Entry point | 69.54 | 68.66 |
| Target Point 1 (TP1) | First resistance: 69.84 | First support: 68.18 |
| Target Point 2 (TP2) | Second resistance: 70.00 | Second support: 67.68 |
| Stop Loss (SL) | 68.66 | 69.54 |
Oil is trading in a downtrend today, supported by technical indicators such as moving averages and MACD in this negative direction. Selling pressure is expected to continue if trading continues below the moving averages.
with the possibility of continuing the decline to lower support levels.


