
USOil Technical Analysis: Today, oil is trading in a downtrend, recording its highest price so far at $68.33 per barrel, and its lowest price at $67.48. Currently, oil is trading at $68.20, indicating relative stability after the decline. This move reflects some selling pressure in the market, which reinforces expectations that the downtrend may continue in the short term.
USOIL Technical Analysis: General Trend Analysis
Oil is showing a downtrend during today’s trading, as prices are trading below the moving averages. This indicates that the market is under selling pressure, and reflects weak purchasing power. Trading prices below the moving averages reinforces the hypothesis of a continued decline in the absence of a radical change in momentum.
Technical Analysis
Moving Averages:
Prices are currently trading below the basic moving averages, which confirms that the general trend for oil is down. This situation reflects the dominance of sellers in the market, and increases the likelihood of a continued decline unless there are shifts in momentum.
MACD Analysis:
The MACD indicator is indicating a negative trend, as it is in the negative zone with a clear divergence between the MACD line and the signal line. This divergence reflects a weakness in the upward momentum and the presence of strength in the downtrend, which increases the possibility of a continuation of the decline in the short term. However, some weakness appears in the negative trend, which may reflect volatility or oscillation in the movement.
Trading Expectations:
Given the trading below the moving averages and with the negative signal from the MACD indicator, oil is likely to continue its downtrend in the short term. We may witness a test of the support level at $67.48, and if it is broken, the decline is likely to continue towards lower levels such as $67.00 or $66.50. On the other hand, any attempt to rise may face strong resistance at the $68.33 level.
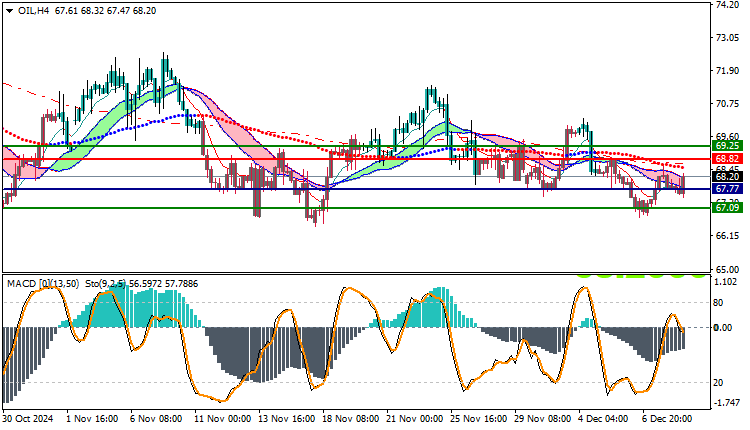
Trading strategies based on Buy/Sell level
| USOIL | In case of buying | in case of selling |
| Entry point | 68.82 | 67.77 |
| Target Point 1 (TP1) | First resistance: 69.25 | First support: 67.09 |
| Target Point 2 (TP2) | Second resistance: 69.59 | Second support: 66.70 |
| Stop Loss (SL) | 67.77 | 68.82 |
Oil is trading in a downtrend supported by trading below the moving averages and the MACD indicator which indicates weak positive momentum. Selling pressure is likely to continue in the short term.
with support levels at $67.48 and $67.00 being monitored to determine the price path in the coming period.


