
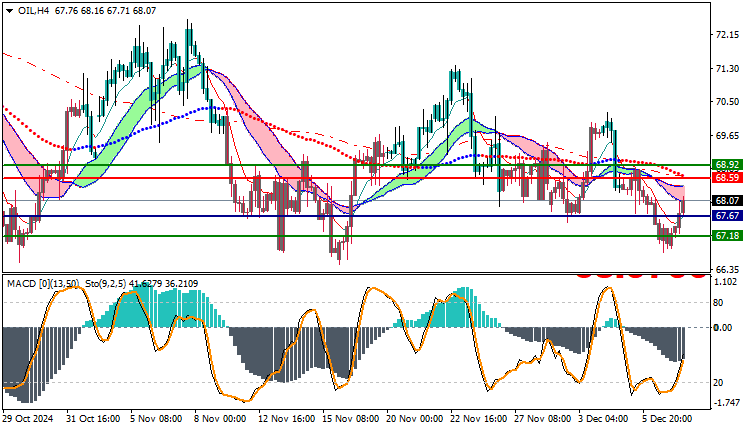
USOil Technical Analysis: The oil market is witnessing a bearish trend today with some weakness in the bearish momentum, as the market records limited movements between low and high prices in the current trading session. Through technical analysis, it appears that the general trend for oil is still negative, but with some signs that may indicate a weakness in the driving force of this trend.
USOIL Technical Analysis: Price Analysis Today’s Lowest Price: $67.16.
- Today’s Highest Price: $68.15.
- Current Price: $68.07.
This data indicates that oil recorded limited volatility during the session, as it moved between low and high levels without being able to achieve major breakthroughs in either direction, indicating some weakness in the current downtrend.
Technical Analysis:
- Moving Averages: Oil prices are currently trading below the major moving average levels, which reflects the overall downtrend. Trading below the moving averages is a negative signal, which increases the possibility of continued negative pressure on prices in the near term.
- MACD Indicator: The MACD indicator is indicating a negative trend, as the crossing of the lines shows a weakness in the upward momentum. In addition, some signs are appearing that indicate weakness in the negative trend, which means that the market may face volatility or a rebound in the near term.
Future Outlook:
Based on the technical analysis, the downtrend in oil is expected to continue during today’s session, especially if the price remains trading below the moving averages. If oil fails to maintain the current level at $68.07, we may witness further decline towards nearby support levels. However, if positive signs appear or the price rebounds above the moving averages, this may indicate the possibility of starting an upward corrective movement.
Trading strategies based on Buy/Sell level
| USOIL | In case of buying | in case of selling |
| Entry point | 68.59 | 67.67 |
| Target Point 1 (TP1) | First resistance: 68.92 | First support: 67.18 |
| Target Point 2 (TP2) | Second resistance: 69.30 | Second support: 66.80 |
| Stop Loss (SL) | 67.67 | 68.59 |
The oil market is currently showing a bearish trend, with negative signals from the moving averages and the MACD. Although the downtrend is still in place, the weak momentum could lead to a short-term volatility or bounce. It is advisable to follow key support and resistance levels to better identify trading opportunities.


