
USDJPY Technical Analysis: The USD/JPY pair is currently trading at 142.52. Looking at the chart, we notice that the pair initially witnessed an upward movement, but this trend has reversed to reflect a shift towards the downside. However, our indicators show that there is a new attempt to move upwards, albeit weak.
USDJPY Technical Analysis: Technical Analysis
- Current Trend:
Rise and Fall: The pair reached its highest price so far at 143.04, while the lowest price was recorded at 142.26. Despite the positive signs, the pair is still stuck in a narrow trading range.
Moving Lines: Prices are trading above the moving averages, indicating potential support at current price levels, however, these levels should be closely monitored.
- MACD Indicator:
MACD Analysis: The MACD indicator indicates a slight weakness in the current upward trend. Although the positive MACD line remains present, its strength is limited, which may indicate that the uptrend is not stable.
- Other indicators:
Trend indicator: The trend indicator plays a crucial role in determining the true strength of the movement. The movements of other indicators should be monitored to ensure the continuation of the trend.
USDJPY Technical Analysis: Trading opportunities
- Upside opportunities: If prices continue to trade above the moving averages and exceed the weakness of the MACD indicator, buying opportunities can be considered with stop loss levels placed below the pivotal support levels.
- Downside opportunities: If the MACD indicator continues to show weakness in the uptrend, there may be an opportunity to sell the pair, especially if prices break the important support levels.
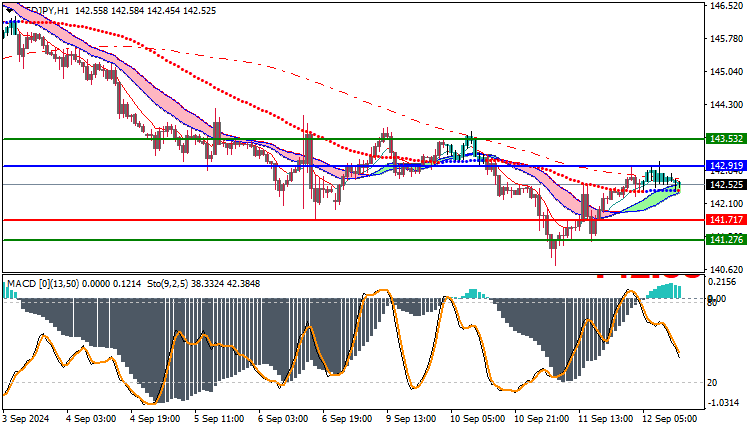
Trading strategies based on Buy/Sell levels
| USDJPY | In case of buying | in case of selling |
| Entry point | 142.91 | 141.71 |
| Target Point 1 (TP1) | First resistance: 143.53 | First support: 141.27 |
| Target Point 2 (TP2) | Second resistance: 143.99 | Second support: 140.90 |
| Stop Loss (SL) | 141.71 | 142.91 |
The technical analysis of the USD/JPY pair indicates a divergence in market signals. Although the prices are trading above the moving averages, the MACD indicator shows a weakness in the upward trend, which adds some caution in making trading decisions. It is advisable to monitor the prices closely and stay updated with technical updates to determine the actual trend and pick the best trading opportunities.


