
USDJPY Technical Analysis: The USD/JPY pair rose today, after it was about to enter a sideways range, thanks to the impact of US economic data, including the unemployment claims report. The pair reached a high of $145.50 and a low of $144.20. After breaking the lower level, the pair continued to rise clearly.
USDJPY Technical Analysis: Technical Analysis
- Moving Averages: The pair is currently trading above the moving averages, indicating support for the uptrend and its continuation. Prices remaining above these averages enhances purchasing power and reflects a positive trend.
- MACD Indicator: The MACD indicator shows the beginning of new buying power, with positive crossovers indicating strengthening the upward momentum. These signals support the positive outlook for the pair and increase the likelihood of the uptrend continuing.
USDJPY Technical Analysis: Recommendations
- Buy: It is recommended to consider buying opportunities when corrections or minor pullbacks occur, targeting higher levels based on the current positive momentum.
- Sell: It is preferable to avoid selling at the moment until the pair shows signs of a change in trend or a significant weakening of purchasing power.
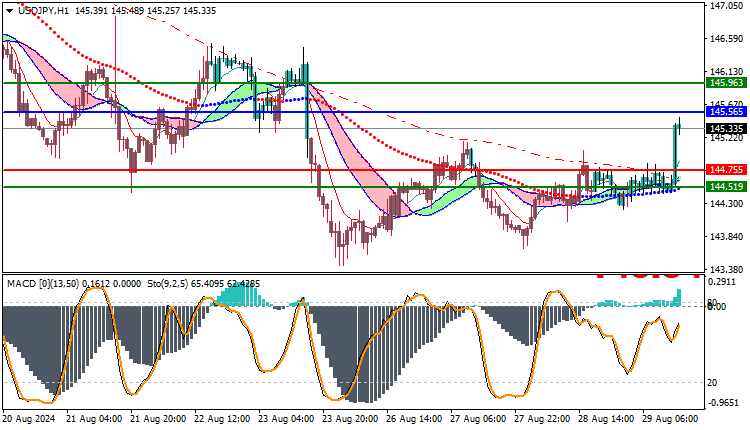
Trading strategies based on Buy/Sell levels
| USDJPY | In case of buying | in case of selling |
| Entry point | 145.56 | 144.75 |
| Target Point 1 (TP1) | First resistance: 145.96 | First support: 144.51 |
| Target Point 2 (TP2) | Second resistance: 146.30 | Second support: 144.30 |
| Stop Loss (SL) | 144.75 | 145.56 |
US economic data has had a positive impact on the USD/JPY pair, pushing prices above the moving averages. The MACD indicator supports the uptrend and reinforces the positive outlook. It is important to follow the market to monitor the continuation of the uptrend and adjust strategies according to any changes in the trend.


