
USDJPY Technical Analysis : The US dollar continues to decline against the Japanese yen following a wave of dovish comments from US Federal Reserve officials, reducing expectations for an interest rate hike.
Conversely, the Japanese yen benefited from renewed demand for safe havens amid growing geopolitical concerns in Asian markets
Technical Indicator Analysis
Moving Averages
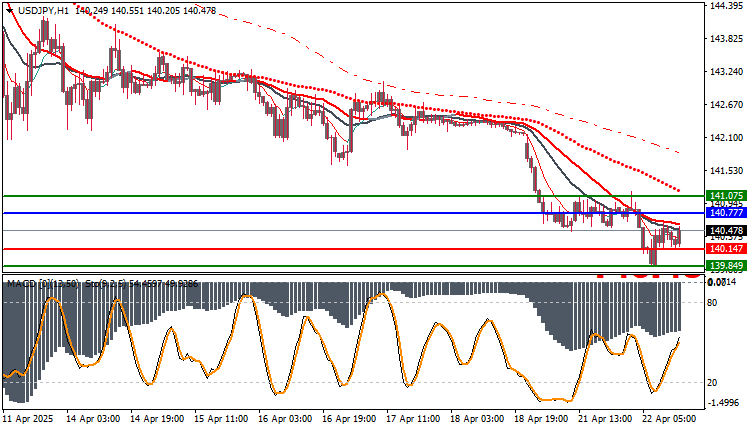
Price below the three moving averages200 EMA clearly bearish – confirming the downside
MACD
In the negative zone
Selling momentum still dominates
Stochastic
Slight rebound from oversold areas
Momentum remains weak so far
Possible Scenarios
Bullish Scenario
A break of 140.77 eases pressure but does not change the trend
The trend turns bullish only with a close above 141.07
Bearish Scenario
A break of 140.14 restores pressure towards 139.84
A break of 139.84 triggers a new selling wave towards 139.20
Trading strategies based on Buy/Sell levels
| In case of buying | in case of selling | USDJPY |
| 140.777 | 140.147 | Entry point |
| First resistance: 141.075 | First support: 139.849 | Target Point 1 (TP1) |
| Second resistance 141.302 | Second support 139.553 | Target Point 2 (TP2) |
| 140.147 | 140.777 | Stop Loss (SL) |
The market is currently attempting a short upward reversal, but within a general trend that remains weak due to the price’s failure to surpass the 200 moving average.
Continuing the current momentum is contingent upon a break of 144.29; otherwise, the current correction wave may end quickly.
The best strategy currently: Buy cautiously from support, sell from resistance with confirmation from indicators, and activate a stop loss near pivot points.


