
USDJPY Technical Analysis The USD/JPY price is trading at 147.41 USD, as prices are trading below most of the moving average crossovers shown on the chart. The MACD indicator also indicates a weak negative trend. Accordingly, we can consider selling in the first session, which is the Asian session, from the decline to 147.20 USD, and the target area could be 146.88 USD. It is also advisable to choose the $147.85 area as a stop loss point to control the risk.
USDJPY Technical Analysis: On the other hand
On the other hand, if the buy zone at $147.85 is broken, the USD/JPY price may head towards the $148.14 level.
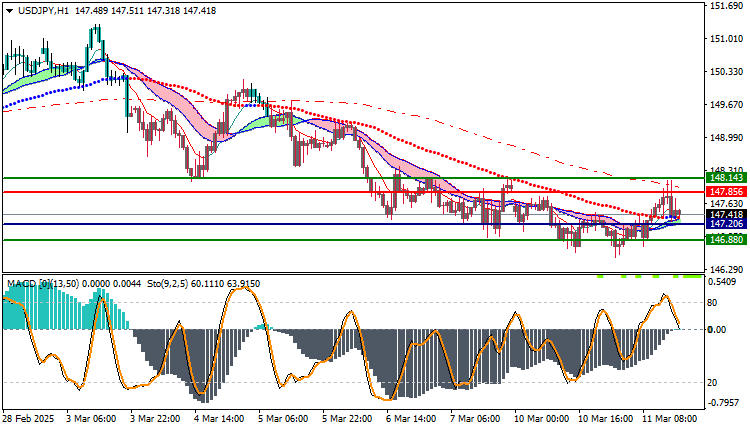
USDJPY Technical Analysis: resistance and support levels
- Second resistance: 147.96
- First resistance: 147.73
- Pivot level: 147.51
- First support: 147.28
- Second support: 147.06


