
USDJPY Technical Analysis today is in a downtrend. As the chart below shows. The USD/JPY price is trading at 155.62, and trading appears below most of the moving average crossovers, as the MACD indicator indicates a negative trend. Accordingly, we can look to buy from the rise to $155.94, and the target area could be $156.38. It is also advisable to choose the $155.06 area as a stop loss point to control the risk.
USDJPY Technical Analysis: On the other hand
On the other hand, if the selling zone at $155.06 is broken, the USD/JPY price may head towards the $154.69 level.
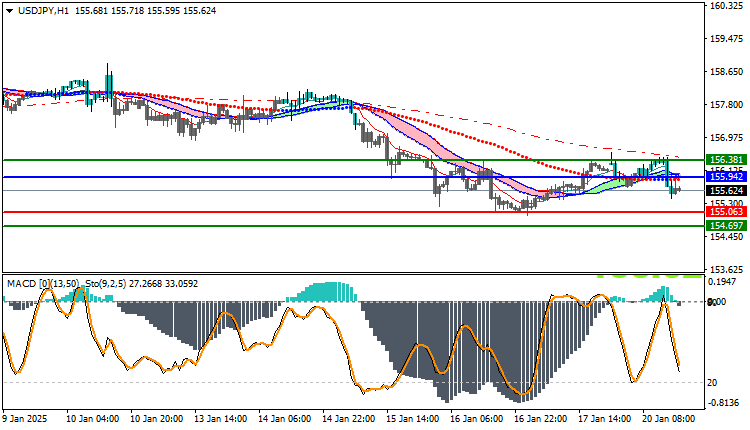
USDJPY Technical Analysis: Resistance and support levels
- Second resistance: 156.12
- First resistance: 155.91
- Pivot level: 155.72
- First support: 155.51
- Second support: 155.32


