
USDJPY Technical Analysis
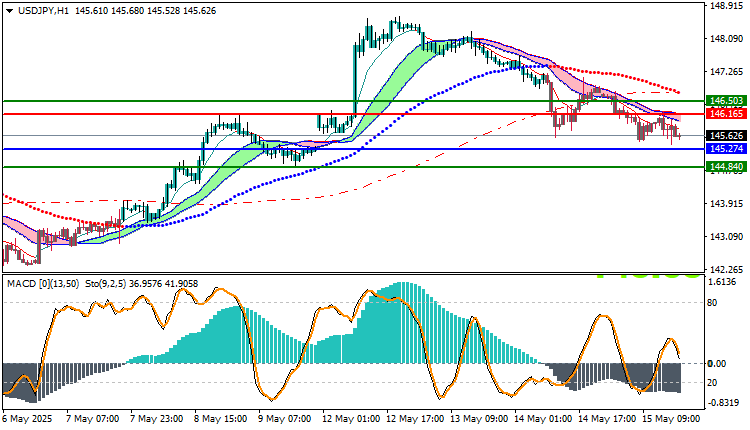
The USD/JPY currency pair is exhibiting a clear bearish trend in today’s trading session, currently hovering around the 145.62 level. The pair is trading below key moving average crossovers, which reinforces the downward momentum. This technical setup signals weakness in the U.S. dollar against the Japanese yen, pointing to a continuation of bearish sentiment in the short term.
Further supporting this bearish outlook is the MACD (Moving Average Convergence Divergence) indicator, which is displaying negative momentum. The MACD line remains below the signal line, and the histogram is positioned in the negative territory—both classic signs of sustained downside pressure.
Given the prevailing technical signals, a sell position appears favorable, particularly on any pullback towards the 145.24 support zone. Should bearish momentum continue, the next downside target would likely be around the 144.84 level, where previous price action suggests a potential area of buying interest or temporary consolidation.
To manage risk effectively, traders should consider placing a stop-loss near the 146.16 resistance level. This level serves as a critical threshold; a break above it may invalidate the current bearish setup and signal a potential shift in market direction.
Overall, today’s technical indicators support a bearish bias for USD/JPY, with selling opportunities favorable below the 145.62 level. Key levels to watch include 145.24 and 144.84 on the downside, while 146.16 remains the key resistance level to manage risk. Traders should continue to monitor broader economic developments and upcoming U.S. or Japanese data releases that may impact market sentiment.
USDJPY Technical Analysis: On the Other Hand
On the other hand, if the buy zone at $146.16 is broken, the USD/JPY price may head towards $146.50.
Resistance and Support Levels
- Second Resistance: 146.03
- First Resistance: 145.83
- Pivot Level: 145.72
- First Support: 145.52
- Second Support: 145.41


