
USDJPY Technical Analysis – April 22, 2025
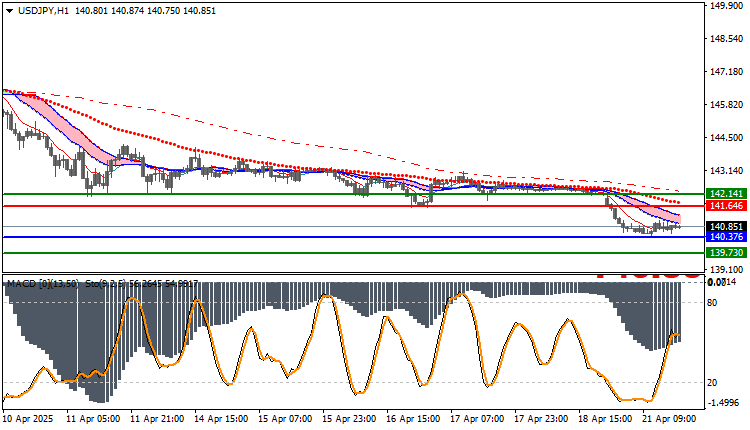
The USD/JPY pair is currently exhibiting signs of a mild upward trend, with the price hovering around 140.85. However, despite this upward movement, the pair is trading below several key moving average crossover levels, which may indicate lingering bearish pressure in the medium term. This mixed signal creates an interesting setup for traders looking for potential reversal or continuation patterns.
Looking at the technical indicators, the MACD (Moving Average Convergence Divergence) is showing a weak downtrend. The MACD line remains below the signal line, suggesting that bullish momentum is not yet strong enough to sustain a longer-term rally. The histogram is also relatively flat, reinforcing the idea of limited upward strength at present.
Based on this setup, there appears to be an opportunity for a short position, especially if the price declines to the support zone near $140.37. A breakdown below this level could open the door for further downside, targeting the next support at $139.73. This would offer a reasonable risk-to-reward ratio for traders positioning for a short-term bearish move.
To manage risk effectively, a stop-loss is advised at the $143.64 level. This area has proven to be a key resistance zone, and a break above it may signal a reversal of the current bearish setup. Placing the stop-loss here provides ample room for the trade to develop while protecting against unexpected upside volatility.
In summary, while the broader trend may appear neutral to slightly bullish, current technical conditions suggest a cautious bearish outlook with a clear entry, target, and stop-loss strategy for short-term traders.
USDJPY Technical Analysis: On the Other Hand
On the other hand, if the buy zone at $143.64 is broken, the USD/JPY price may head towards $142.14.
USDJPY Technical Analysis: Resistance and Support Levels
- Second Resistance: 141.09
- First Resistance: 140.96
- Pivot Level: 140.88
- First Support: 140.75
- Second Support: 140.67


