
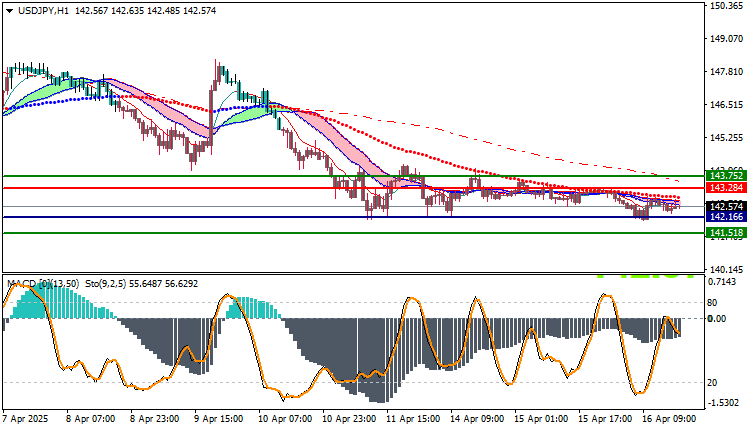
USDJPY Technical Analysis : The USD/JPY pair is exhibiting a bearish trend today, as evidenced by the current price action and technical indicators. At the time of analysis, the pair is trading around 142.57, which places it below the majority of key moving average crossovers. This positioning suggests sustained selling pressure and a lack of bullish momentum in the short term.
Further supporting this bearish outlook is the Moving Average Convergence Divergence (MACD) indicator, which reflects a weak downtrend. The MACD line is positioned below the signal line, reinforcing the current downward sentiment in the market. Momentum appears to be fading, and buyers are struggling to push the price higher.
Given this technical setup, traders may consider a short position if the price breaks below the 142.16 support level. This move would likely confirm continued downside momentum, with a potential target near the 141.51 level, where the next key support lies. This target offers a reasonable risk-to-reward ratio, assuming continued bearish pressure.
However, it’s important to manage risk effectively in case the trend reverses. For this reason, a stop-loss order is recommended at the 143.28 level. This zone serves as a key resistance point and sits above the recent consolidation range, providing a logical level for invalidating the bearish setup.
In conclusion, the USD/JPY pair is showing signs of continued weakness, and short positions may be favorable under current conditions. Monitoring support and resistance levels, along with momentum indicators like the MACD, can help traders make more informed decisions.
USDJPY Technical Analysis: On the Other Hand
On the other hand, if the buy zone at $143.28 is broken, the USD/JPY price may head towards $143.75.
USDJPY Technical Analysis: Resistance and Support Levels
- Second Resistance: 143.01
- First Resistance: 142.80
- Pivot Level: 142.65
- First Support: 142.44
- Second Support: 142.29


