
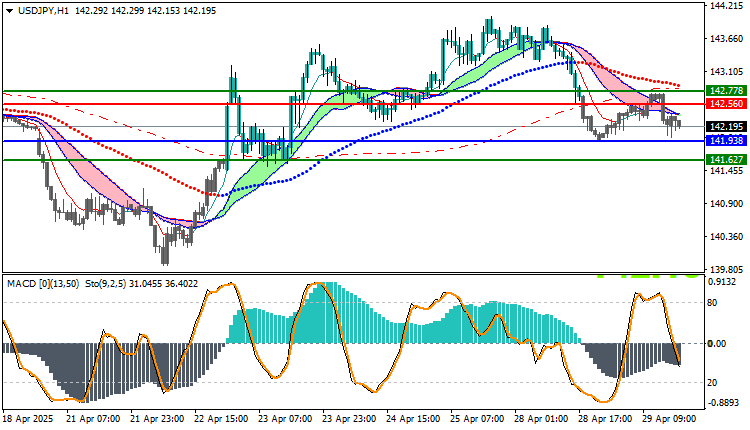
USDJPY Technical Analysis: The USD/JPY pair is currently exhibiting a bearish trend, with price action confirming downward pressure in today’s trading session. As of the latest data, the pair is trading at 142.19, remaining under key moving average levels. This positioning below most moving average crossovers reinforces the bearish sentiment in the market.
Technical indicators further support this bearish outlook. The MACD (Moving Average Convergence Divergence) indicator is signaling continued downside momentum, as its histogram and signal line reflect negative divergence. This adds to the conviction that the market may experience further selling pressure in the near term.
Based on the current price behavior and technical indicators, a short position could be considered, particularly if the price continues to decline toward the support level at 141.93. A breakdown below this level may open the path for a deeper move toward the next target at 141.62. These levels are identified as potential take-profit zones for bearish traders.
To manage risk effectively, placing a stop-loss order around 142.56 is advisable. This level has shown previous resistance and could act as a barrier to further upside. Should the price rebound and break above this point, it would invalidate the current bearish outlook, and traders should consider reassessing their positions.
In conclusion, the overall trend for USD/JPY remains bearish for today, with technical indicators and price action suggesting the potential for further downside movement. However, as always, traders should monitor price developments closely and adjust their strategies in line with evolving market conditions.
USDJPY Technical Analysis: On the Other Hand
On the other hand, if the buy zone at $142.56 is broken, the USD/JPY price may head towards $142.27.
Resistance and Support Levels
- Second Resistance: 142.51
- First Resistance: 142.41
- Pivot Level: 142.27
- First Support: 142.17
- Second Support: 142.03


