
USDCHF Technical Analysis: The USD/CHF pair is witnessing an upward trend with the pair entering a sideways zone, with the highest price recorded so far at 0.91169 and the lowest price at 0.91094, while it is currently trading at 0.91147. This indicates a narrow range of oscillation, reflecting a state of hesitation in the market, despite the general upward trend.
USDCHF Technical Analysis: Technical Analysis
Technically, prices are trading above the moving averages, which supports the current upward trend. The MACD indicator is also indicating a positive trend, as the bullish momentum is showing in the market. However, weak buying power has been observed recently, which may indicate a decline in the bullish momentum and the lack of strong support to continue the rise.
Trading Outlook:
Based on the current technical analysis, the pair appears to be continuing its upward path but with oscillation in a narrow range. In case the weak buying power continues, the pair may enter a phase of consolidation or sideways oscillation for a short period before determining its next direction. If the buying pressure continues, the pair is likely to try to test higher resistance levels.
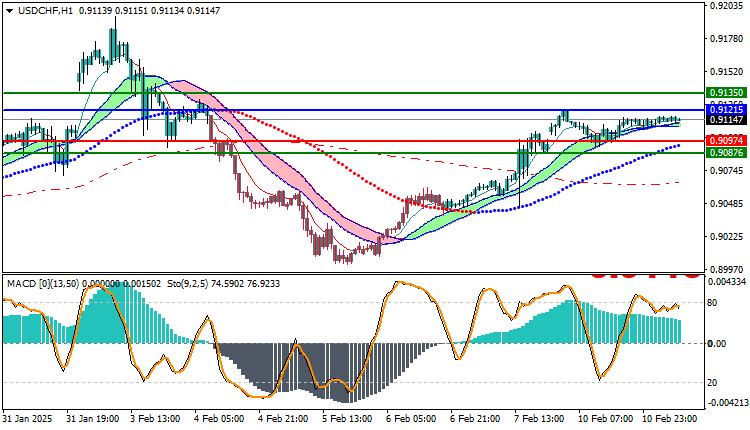
Trading strategies based on Buy/Sell levels
| USDCHF | In case of buying | in case of selling |
| Entry point | 0.91215 | 0.90974 |
| Target Point 1 (TP1) | First resistance: 0.91350 | First support: 0.90876 |
| Target Point 2 (TP2) | Second resistance: 0.91520 | Second support: 0.90711 |
| Stop Loss (SL) | 0.90974 | 0.91215 |
While the uptrend remains intact, weak buying power may indicate that the uptrend may weaken in the short term. It is important to monitor price action within this sideways range carefully, as this area may indicate a potential trend reversal in the near future.


