
The USDCHF pair has been moving in a bullish range during last week’s trading, maintaining its stability above important support levels, with some weakness in positive momentum recently, as markets await important US data.
USDCHF Technical Analysis: General Technical Outlook
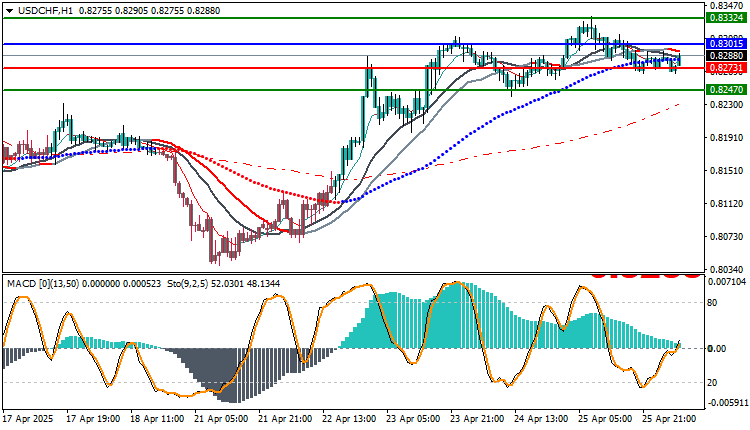
The chart shows fluctuating movement above the 0.8180 support level and has so far failed to clearly break the 0.8300 resistance level. The current trend is sideways with a slight upward bias as long as the price remains above 0.8230.
Technical Indicators Analysis:
- Moving Averages: The price is moving close to the short-term moving averages (20-50 hours), reflecting a clear weakening trend.
- MACD: Losing momentum but not confirming a clear sell signal.
- Stochastic: Reflecting the beginning of an attempt to rebound from neutral zones.
Possible Scenarios for the USDCHF
Bullish Scenario
0.8310: First nearby resistance after breaking 0.8300, the pair’s recent high.
0.8325: Minor technical resistance level based on a small peak formed during corrective waves.
0.8340: An important peak recorded by the pair on the hourly chart, representing a strong momentum test.
0.8355: A natural upward extension, representing the 50% Fibonacci retracement of the recent downward wave.
0.8370: Minor psychological resistance, as numbers ending in “70” typically represent buy/sell positions.
0.8385: A resistance area based on a previous overbought area at this number.
0.8400: A significant and large psychological number, usually attracting large buy and sell orders (a round number).
Bearish Scenario
0.8215: The first minor support near 0.8230, representing the first test of the downside.
0.8200: Psychological support, as large even numbers (such as 0.8200) are areas of market concentration.
0.8185: A previous local low, a minor key support level.
0.8170: Technical support corresponding to a price reversal that occurred on April 22.
0.8155: Continued weakness is pushing the pair towards this area, a horizontal correction zone.
0.8140: Important historical support formed after a sharp rally in mid-April.
Trading strategies based on Buy/Sell levels
| In case of buying | in case of selling | USDCHF |
| 0.83015 | 0.82731 | Entry point |
| First resistance: 0.83324 | First support: 0.82470 | Target Point 1 (TP1) |
| Second resistance 0.83624 | Second support 0.82170 | Target Point 2 (TP2) |
| 0.82731 | 0.83015 | Stop Loss (SL) |
The USDCHF pair is moving in a narrow range between the 0.8230 support and the 0.8300 resistance level, and a break of either level could clearly determine the next direction. We recommend monitoring this week’s data carefully before making any major trading decisions.
Important Economic Data This Week That Impacts USDCHF:
- Wednesday, April 30: US GDP (q/q) data – has a significant impact on the movement of the dollar and, consequently, the USD/CHF.
- Thursday, May 1: Personal Consumption Expenditures (PCE) Index – a core inflation measure monitored by the US Federal Reserve.
- US unemployment claims: Important for assessing the health of the US labor market.
- Swiss National Bank (SNB) monetary policy meeting: May also influence the franc’s movements.


