
US Session, Date: 8/26/2024
Introduction and Overview
In this technical analysis, we will study the performance of the USDCAD pair by reviewing the main price trends, important technical levels, and current trading patterns. We will use a set of technical tools and indicators to provide a comprehensive and in-depth view of the USDCAD pair’s movement in the market. The USDCAD is currently trading at $1.3495. Prices are trading below most of the moving average crosses, indicating a strong downtrend. The MACD indicator is indicating a negative trend with some crosses appearing in the strength of the trend.
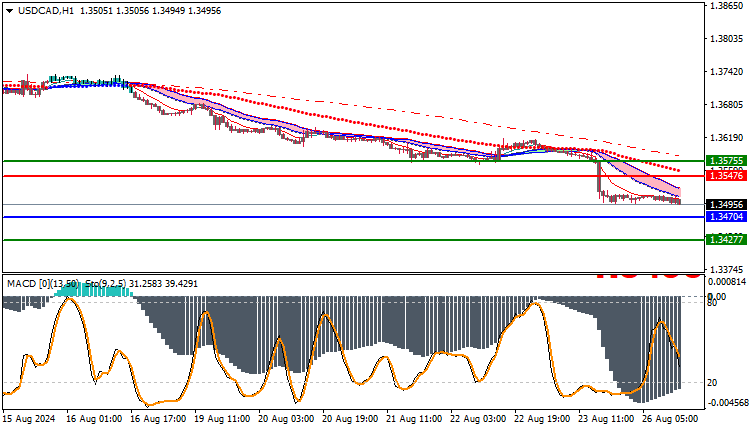
Trading strategies based on Buy/Sell levels
| USDCAD | In case of buying | in case of selling |
| Entry point | 1.3547 | 1.3470 |
| Target Point 1 (TP1) | First resistance: 1.3575 | First support: 1.3427 |
| Target Point 2 (TP2) | Second resistance: 1.3598 | Second support: 1.3390 |
| Stop Loss (SL) | 1.3470 | 1.3547 |
Conclusion
These strategies are based on determining the price’s location relative to support and resistance levels, and suggest the best ways to profit from price movements based on these indicators. Traders should carefully monitor these levels to identify optimal opportunities to enter and exit the market, while adhering to appropriate risk management strategies to protect their investments.


