
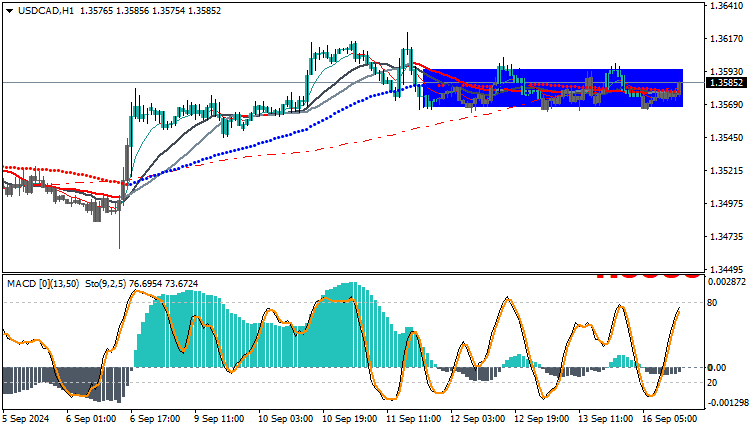
The USDCAD pair opened this week at 1.3590, and achieved its highest price so far at the same level of 1.3590, while the lowest price reached 1.3565. The pair is currently trading at 1.3585, which shows that trading is taking place in a sideways range between the resistance areas at 1.3590 and the support at 1.3565.
Narrow Trading and Sideways Movement
The chart shows that the pair is trading in a narrow price movement between the support and resistance levels, which indicates that there is no clear and strong trend in the market at the moment. This fluctuation reflects a state of caution among traders and a lack of decisive positions.
Moving Averages and MACD Indicator
The moving averages are located below the current price of the pair, which gives a positive signal in the short term, but the MACD indicator shows weakness in the downward trend, which means that the pair may continue to move within this sideways range for some time before any clear trend appears.
USDCAD Futures
Based on the current analysis, the USDCAD pair appears to have enough momentum to continue rising in the short term. However, traders should closely monitor the market and pay attention to any negative signals that may emerge from technical indicators
Trading strategies based on Buy/Sell levels
| USDCAD | In case of buying | in case of selling |
| Entry point | 1.3590 | 1.3565 |
| Target Point 1 (TP1) | First resistance: 1.3620 | First support: 1.3535 |
| Target Point 2 (TP2) | Second resistance: 1.3650 | Second support: 1.3505 |
| Stop Loss (SL) | 1.3565 | 1.3590 |
The USDCAD pair is currently trading in a narrow sideways range, which requires careful monitoring of support and resistance levels. With signs of weakness on the MACD indicator, this volatility may continue in the near term, making it important to closely monitor technical developments to identify any potential new direction.


