
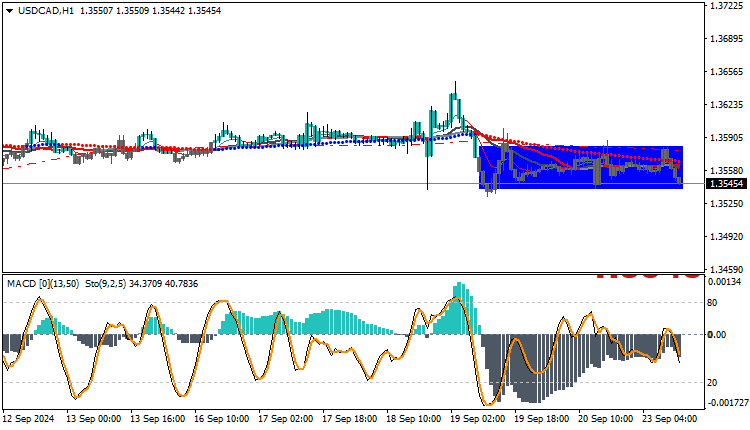
The USDCAD pair is trading today at $1.3545 after a period of sideways price movement. Current technical signals indicate that this sideways movement will continue, with the pair trading below the moving averages’ crossovers, reinforcing the negative signals provided by the MACD indicator. In this analysis, we will review the pair’s performance and analyze the technical expectations in the short and medium term.
Technical Outlook for the USDCAD pair
On the daily time frame, the USDCAD pair is trading in a sideways range between specific support and resistance levels. The price has failed to break the major resistance at $1.3600, reinforcing the sideways trend. With the pair remaining below the moving averages such as the 50 and 100 days, the bearish momentum remains strong, indicating continued negative pressures.
The MACD indicator shows a continuation of the negative momentum, with the negative line below the positive line, indicating continued selling pressures. This weakens the possibility of any strong bullish breakout in the short term.
Trading strategies based on Buy/Sell levels
| USDCAD | In case of buying | in case of selling |
| Entry point | 1.3590 | 1.3540 |
| Target Point 1 (TP1) | First resistance: 1.3620 | First support: 1.3510 |
| Target Point 2 (TP2) | Second resistance: 1.3650 | Second support: 1.3480 |
| Stop Loss (SL) | 1.3540 | 1.3590 |
Based on the current technical analysis, the USDCAD pair shows a continuation of the sideways movement with clear negative signals from the MACD indicator, indicating the possibility of continuing the downward pressures in the coming period. As long as the price remains below the main moving averages, the chances of an upward correction will remain limited, with the expectation of continuing trading in the current sideways range between the support levels at 1.3500 and the resistance at 1.3600.


