
US30 technical analysis today. The Dow Jones Industrial Average held near its recent highs during this week’s trading, supported by investor expectations that the US economy will continue to expand at a steady pace. However, with buying momentum beginning to wane, signs of caution are emerging on short-term charts, requiring close monitoring of critical technical levels.
US30 technical analysis today: Technical Overview
- The Dow Jones Index is currently trading near 42,799 points after a strong upward trend that took it to highs of 42,938, before witnessing a slowdown in momentum in recent sessions.
- The index is showing a horizontal slope above its moving averages, with a repeated test of the 42,800 level as short-term resistance.
- The overall trend remains upward, but with a clear deviation from the strong momentum path.
- Declining trading volume and weak breakouts indicate a limited correction unless new catalysts emerge.
Technical Indicator Analysis:
MACD: is showing a decline in positive momentum, which could indicate a short-term correction if the breakout of 42,938 is not confirmed.
Stochastic: remains in positive territory but is trending down from oversold areas, enhancing the possibility of a temporary rebound.
Moving Averages: The index remains above the 50- and 100-hour averages, maintaining a generally positive trend as long as 42,400 is not breached.
Expected Scenarios for Today:
Potential Upside:
- If the price stabilizes above 42,800 and then breaks 42,938, the next target will be 43,060.
- A breakout of this area will push the Dow towards the 43,250 area, which is important weekly resistance.
Corrective Downside:
- A break of the nearby support at 42,690 paves the way for a drop to 42,535 and then 42,125, an important support point to watch.
- A break of 42,125 could lead to a change in the short-term trend, targeting 41,950 as a pivot point.
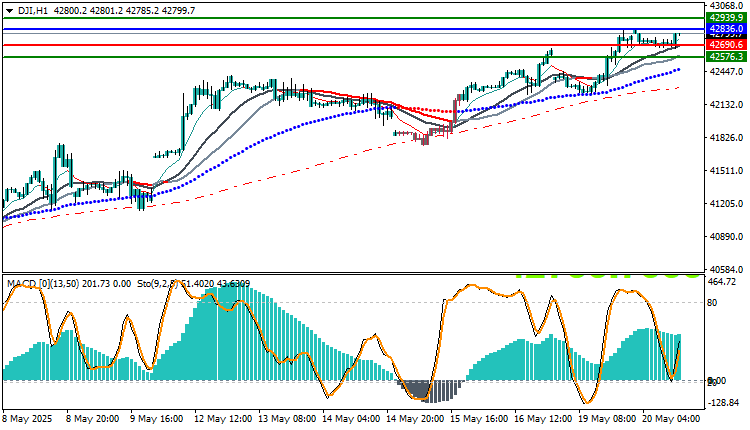
Trading strategies based on Buy/Sell levels
| US30 | In case of buying | in case of selling |
| Entry point | 42836.0 | 42690.0 |
| Target Point 1 (TP1) | First resistance: 42939.0 | First support: 42576.0 |
| Target Point 2 (TP2) | Second resistance: 43000.0 | Second support: 42500.0 |
| Stop Loss (SL) | 42690.0 | 42836.0 |
The Dow Jones Index is still moving in a comfortable upward range, but its proximity to key resistance areas and weak momentum prompt us to be cautious. A break or breach of any of the aforementioned pivotal levels will determine the index’s next direction. We advise traders to monitor the index’s interaction with the 42,938 resistance areas and 42,535 support areas to make informed decisions in today’s session.
Important Economic News Impacting the Index (May 20, 2025):
- Statements by Federal Reserve members, which may hint at future interest rates, will have a direct impact on the index.
- US Existing Home Sales Data: Any surprises in the results could return volatility to US markets.


