
US30 technical analysis today. The Dow Jones is trading in a narrow range above 41,000, following a series of strong gains supported by improved US growth data and easing inflationary pressures.
The index is in a clear consolidation mode ahead of tomorrow’s US employment data, which could push it to break through historic levels.
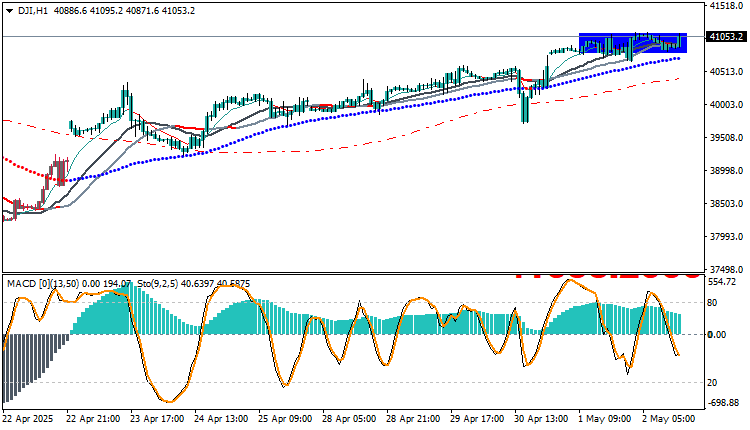
US30 technical analysis today: Technical Overview
- The price is stable within a horizontal resistance zone (blue band)
- The general trend remains bullish unless 40,700 is broken
- Trading above the moving averages confirms the continuation of positive momentum
Technical Indicator Analysis:
- EMA: The index is above the three moving averages, in a bullish order
- MACD: In a positive range, but momentum is starting to slow
- Stochastic: In the middle zone (40-60), supporting continued consolidation before a breakout
US30 technical analysis : Expected Scenarios for Today:
Potential Upside:
- Upon breaking 41,100, it will head towards:
- 41,230
- 41,380
Corrective Downside:
- Upon breaking 40,750, it will return towards:
- 40,560
- 40,390
Trading strategies based on Buy/Sell levels
| US30 | In case of buying | in case of selling |
| Entry point | 41080.0 | 40779.0 |
| Target Point 1 (TP1) | First resistance: 41150.0 | First support: 40700.0 |
| Target Point 2 (TP2) | Second resistance: 41220.0 | Second support: 40620.0 |
| Stop Loss (SL) | 40779.0 | 41080.0 |
The Dow Jones is in a phase of sideways price pressure awaiting a new catalyst. A break above 41100 would trigger a strong upward trend, while a break below 40700 could trigger a broader correction.
Expected Economic Data:
- Friday, May 2, 2025:
- Nonfarm Payrolls (NFP) Report
- Unemployment Rate
US employment data is one of the most important drivers of the Dow Jones Index, as it determines the general direction of monetary policy and, consequently, risk appetite on Wall Street.


