
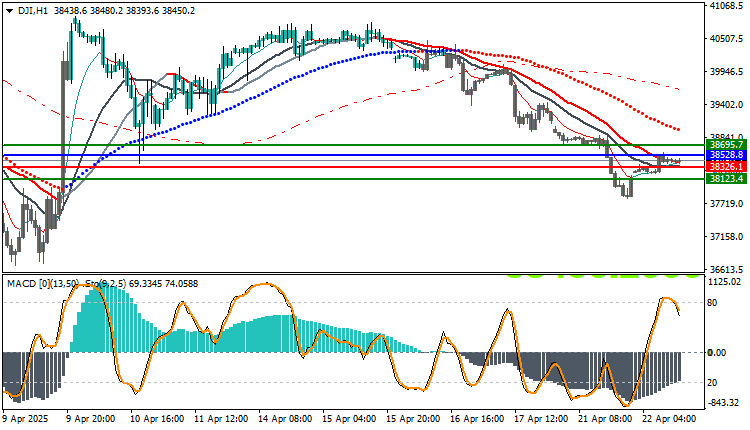
The Dow Jones index experienced a sharp decline over the past week, affected by negative economic data and selling pressure in the US markets. At the beginning of this week, the index began to form a support base around the 38123 area, attempting a technical rebound to test nearby resistance levels.
General Technical Outlook
- The general short-term trend: Remains bearish despite attempts at a rebound.
- Signs of weakness in selling momentum appear with a temporary breakout of the short-term moving averages.
- The price is currently fluctuating within a narrow horizontal range, which may pave the way for a strong upcoming move.
Technical Indicators Analysis
- MACD: A clear bullish crossover has occurred, but momentum has begun to decline, indicating a potential slowdown.
- Stochastic: In neutral zones around 50, indicating a current lack of direction.
- Moving Averages: The price is trading below the long-term moving averages and above the short-term moving averages, supporting the view of volatility.
Important Technical Levels
Support Areas:
- 38326 – First Support.
- 38214 – Moderate technical support.
- 38123 – Strong support and current week’s low.
Resistance areas:
- 38528 – Current immediate resistance.
- 38695 – Pivotal resistance that must be breached to confirm the upside move.
- 38975 – Strong resistance and could be a target if a strong rebound occurs.
Possible scenarios
Bullish scenario:
- Rise to test the resistance level of 38528.
- Breaking 38695 paves the way for continued upward movement towards 38975.
- Breaking 38975 could open the way towards 39200 in the short term.
Bearish Scenario:
- A decline towards 38214.
- A break of this level will push towards the most important support at 38123.
- A break of 38123 will restore the bearish trend towards 37800.
Trading strategies based on Buy/Sell levels
| US30 | In case of buying | in case of selling |
| Entry point | 38528.8 | 38326.1 |
| Target Point 1 (TP1) | First resistance: 38695.7 | First support: 38123.4 |
| Target Point 2 (TP2) | Second resistance: 38800.0 | Second support: 37900.0 |
| Stop Loss (SL) | 38326.1 | 38528.8 |
The Dow Jones Index is showing some technical signs of a rebound attempt, but without a clear break of the major resistance levels, the downtrend remains dominant. Monitoring the 38,695 level is recommended as a key to a positive turnaround, while being cautious of a break above 38,123, which could trigger a sharp decline.
Impactful Economic Data This Week:
- US Federal Reserve officials’ statements and hints on interest rates and inflation.
- Home sales and durable goods data.
- Earnings reports from major companies, which play a pivotal role in influencing US stock indices.


