
Tesla Inc. stock has experienced sharp fluctuations over the past few weeks, amid significant technical shifts and selling pressure that have become evident over the short-term. With global market tensions continuing and anticipation of US economic indicators growing, new signals are emerging that could alter the stock’s movement during today’s trading.
Today, we present a professional technical analysis of TSLA stock, based on the latest charts, with a comprehensive overview of the current trend, technical forecasts, key price levels, and the impact of anticipated economic events.
Market Overview and Tesla Stock Price
- Current Price: $241.34
- Recent Price Range: $233.67 – $250.54
- Stock Movement: Marked by sharp volatility, with clear selling pressure below the key resistance area of $250.50
Major Support: $226.77
Nearby Resistance: $250.54
The stock has once again approached strong support areas, opening up the possibility of a short-term rebound or a downward break to deeper levels.
TSLA Stock Technical Analysis
General Trend:
The stock is moving in a downward-sloping sideways trend, after failing to surpass the $256.60 resistance and starting to form successive lower highs.
Technical Indicators:
- MACD: Negative, with declining momentum and weak upward attempts.
- Stochastic Oscillator: In oversold areas, which may indicate an imminent temporary rebound.
- Moving Averages: The price is below the 20- and 50-day moving averages, reinforcing the negative outlook.
Today’s Technical Outlook
If selling pressure continues, a break of the 234.70 level will push the stock to retest the 226.77 area. However, if rebound signals appear with positive economic data, we may witness a test of the 241.30 resistance level and possibly an attempt to breach 250.50 later.
Likely Scenario: Limited decline to test the 234.70 support level with the possibility of a temporary rebound.
Caution Required: A break of 233.50 could accelerate the downward wave.
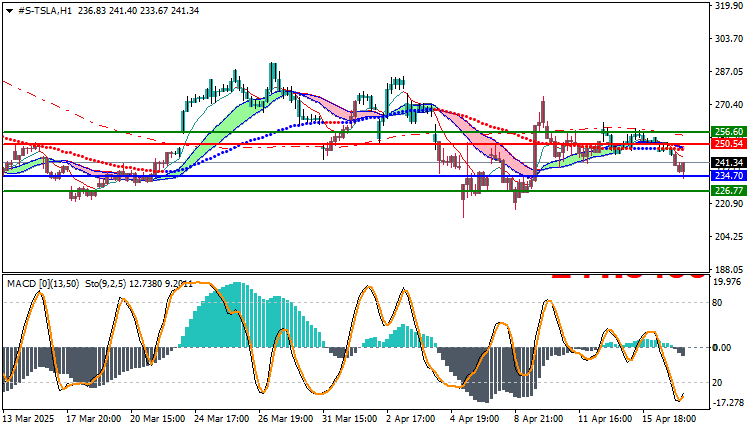
Trading strategies based on Buy/Sell levels
| Tesla Stock | In case of buying | in case of selling |
| Entry point | 250.54 | 234.70 |
| Target Point 1 (TP1) | First resistance: 256.60 | First support: 226.77 |
| Target Point 2 (TP2) | Second resistance: 261.40 | Second support: 220.45 |
| Stop Loss (SL) | 234.70 | 250.54 |
Tesla stock today represents an opportunity for short-term traders, provided they closely monitor economic data and detect signs of a rebound. Sellers still dominate the technical scene, but near support levels could spark some positive movement.


