
Tesla Stock Technical Analysis: Tesla stock is trading in a weak upside trend today, as the stock started to make small gains after a temporary decline. The stock recorded its highest price today at $445, before falling to its lowest level at $416. Currently, the stock is trading near the $420 level. These movements reflect a weakness in the upside trend, as the price fluctuates within a narrow range.
Tesla Stock Technical Analysis: Price Analysis
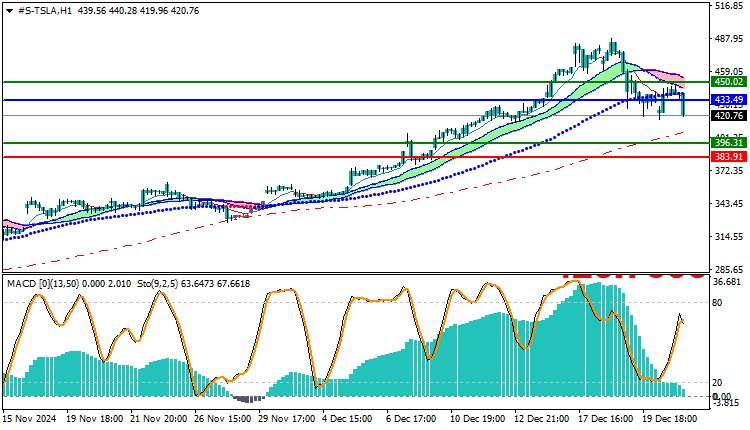
Prices are currently trading below the moving averages, reflecting a weakness in the stock’s upward momentum. Trading below the short- and medium-term moving averages indicates that the market is facing strong resistance that prevents the continuation of the rise. These technical indicators reduce the chances of a sustainable rise at the moment, and show that the upside trend is not strong enough.
Technical Analysis:
Moving Averages:
Moving averages indicate a weakness in the upward momentum, as the stock is trading below these averages in the short term. These indicators suggest that the stock is currently unable to surpass the resistance levels.
which increases the possibility that the uptrend is unsustainable in the near term, and makes the market vulnerable to selling pressure if this situation continues.
MACD Indicator Analysis:
MACD indicates a weak positive trend, as the indicator shows a bullish crossover between the MACD line and the signal line. However, it reflects a weakness in the upward momentum, which means that the gains may be short-term and unsustainable. If this weakness continues, the stock may face difficulty in achieving further gains, as the uptrend will be limited.
Trading Outlook:
With trading below the moving averages and negative signals from the MACD indicator, the uptrend remains weak, and the stock may face difficulty in continuing its rise. If the stock fails to surpass nearby resistance levels such as $445, it may decline towards stronger support levels such as $410 or lower. It is important to follow these levels to determine whether the stock will continue to decline or succeed in regaining some gains.
Trading strategies based on Buy/Sell levels
| Tesla Stock | In case of buying | in case of selling |
| Entry point | 433 | 396 |
| Target Point 1 (TP1) | First resistance: 450 | First support: 383 |
| Target Point 2 (TP2) | Second resistance: 460 | Second support: 374 |
| Stop Loss (SL) | 396 | 433 |
Tesla stock is currently trading in a weak uptrend, with technical indicators such as moving averages and MACD showing weak upward momentum. If trading below these averages continues, the stock may struggle to maintain the uptrend.
with a potential pullback towards stronger support levels.


