
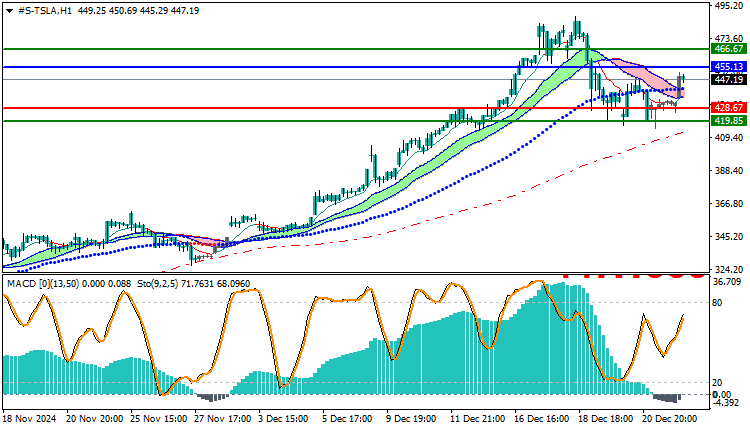
Tesla Stock Technical Analysis: Tesla stock is trading in a downtrend today with weak downside momentum, as the stock recorded its highest price so far at $452, while recording its lowest price at $434. Currently, the stock is trading at $447, indicating limited volatility within the current trading range. Technical analysis shows that prices are trading above the moving averages, which weakens the downside trend and enhances the chances of upward corrections.
Tesla Stock Technical Analysis: Technical Analysis
By analyzing the moving averages, we notice that the stock is trading above the short- and long-term moving averages, which indicates the presence of potential support that may limit the continuation of the downside trend. This support above the averages reflects the weakness of the current downside trend, which means that there is a chance for an upward correction or even a change in trend if the stock continues to hold above these levels.
MACD Indicator:
MACD Indicator shows a negative trend, but weak in terms of momentum. This suggests that the downtrend is not strong enough to push the stock to consistently lower levels. Weak negative momentum indicates hesitation in the market, and may reflect a desire for correction or temporary price stability.
Today’s Trading Outlook:
The stock is expected to remain in a weak downtrend during the day, with the potential to test strong support levels near $440. If this level is broken, the stock may head towards lower support levels at $434. However, if the stock is able to hold above $440, it may witness an upward correction towards resistance levels at $450.
Trading strategies based on Buy/Sell levels
| Tesla Stock | In case of buying | in case of selling |
| Entry point | 455 | 428 |
| Target Point 1 (TP1) | First resistance: 466 | First support: 419 |
| Target Point 2 (TP2) | Second resistance: 470 | Second support: 414 |
| Stop Loss (SL) | 428 | 455 |
Technical analysis indicates that Tesla stock is trading in a weak downtrend, with prices trading above the moving averages, which weakens the downtrend. The MACD indicator is showing weak negative momentum, indicating that the downtrend is not strong enough to pressure prices on a sustained basis. The stock remains volatile, with potential upward corrections if it holds above support levels.


