
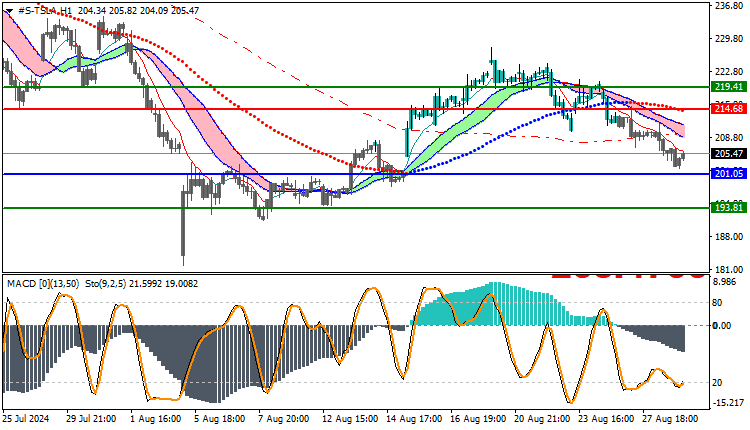
Tesla Stock Technical Analysis: Tesla stock continues its downward trend today, recording a high of $212 and a low of $201, and is currently trading at $205. The analysis indicates a weakness in purchasing power due to the failure to break the high level of today’s price, which reinforces the downward trend.
Tesla Stock Technical Analysis: Technical Indicators
- Moving Averages: The stock is trading below the moving average levels, which supports the continuation of the downward trend.
- MACD Indicator: The MACD indicator shows confirmation of the negative trend, as it records a reading below the zero level, reflecting significant downward pressures.
Tesla Stock Technical Analysis: Possible Recommendations
It is advisable to monitor the nearby support levels at $201. If this level is broken, the stock may witness an additional decline towards lower levels. In the event of an upward rebound, the stock’s ability to exceed the resistance level at $212 should be monitored.
Trading strategies based on Buy/Sell levels
| Tesla Stock | In case of buying | in case of selling |
| Entry point | 214 | 201 |
| Target Point 1 (TP1) | First resistance: 219 | First support: 193 |
| Target Point 2 (TP2) | Second resistance: 224 | Second support: 185 |
| Stop Loss (SL) | 201 | 214 |
The bearish trend continues to dominate Tesla stock based on technical analysis and MACD indicator. It is recommended to follow a cautious strategy and closely monitor the price action to make trading decisions based on immediate market developments.


