
Tesla Stock Technical Analysis: Tesla stock is witnessing a downtrend today, as the stock continues its corrective path after reaching the highest level during the session at $313.07, while recording the lowest level at $295.73. Currently, the stock is trading at $302.66.
Tesla Stock Technical Analysis: Technical Analysis
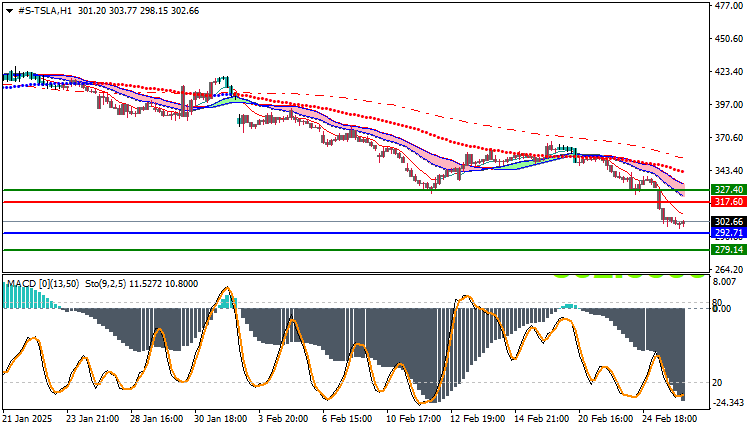
- Moving Average Indicators: The stock appears to be trading below the moving average levels, which reinforces the hypothesis of the continuation of the downtrend in the short term. This signal supports the possibility of the continuation of the negative movement.
- MACD Indicator: The MACD indicator shows a negative signal, as it indicates the possibility of weak upward momentum and increasing selling pressure. The MACD indicator reflects a clear downtrend, which reinforces the image of the current price trend.
Trading Expectations:
Based on the current technical analysis, the stock is likely to continue its decline during the upcoming sessions if trading continues below the moving average levels. If the negative momentum continues to pressure the price, we may see the stock reach stronger support levels around $292.71. It is worth noting that any sudden upward moves may face strong resistance at $317.60 levels.
Trading strategies based on Buy/Sell levels
| Tesla Stock | In case of buying | in case of selling |
| Entry point | 317.60 | 292.71 |
| Target Point 1 (TP1) | First resistance: 327.40 | First support: 279.14 |
| Target Point 2 (TP2) | Second resistance: 334.20 | Second support: 270.22 |
| Stop Loss (SL) | 292.71 | 317.60 |
Tesla stock appears to be continuing its downtrend, with prices trading below the moving averages and MACD showing negative signals. It is important to closely monitor the stock’s movement over the coming sessions for clear signals on whether the trend is continuing or a possible bullish bounce is imminent.


