
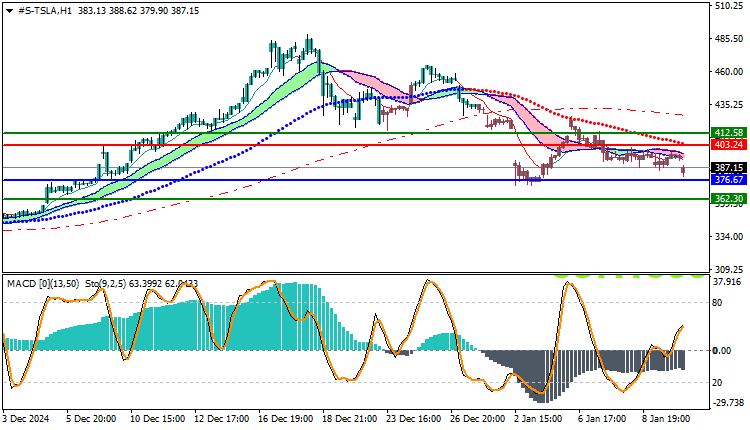
Tesla Stock Technical Analysis: Tesla stock is trading in a downtrend today, recording its highest price so far at 392 and its lowest price at 378, and is currently trading near the 387 level. This price action indicates selling pressure on the stock, reflecting the decline in bullish momentum in the market.
Tesla Stock Technical Analysis: Technical Analysis
Moving Averages:
Tesla stock is currently trading below the main moving averages, which reinforces the bearish technical outlook. When prices are below the moving averages, this reflects weak buying momentum, and increases the likelihood of continued selling pressure on the stock unless a clear breakout of resistance levels occurs.
MACD Indicator Analysis:
MACD indicator shows clear negative signals as the MACD line is trading below the Signal Line, reinforcing the expected downtrend. This negative signal indicates the absence of bullish momentum and supports the idea of a continued decline in the stock in the short term.
Tesla Technical Analysis: Future Outlook:
Based on the current technical analysis, Tesla stock is expected to continue its downward movement in the short term, with the possibility of testing the nearby support levels around 378. If the stock fails to surpass the 392 level and hold above it, we may witness further decline towards lower levels.
Trading strategies based on Buy/Sell levels
| Tesla Stock | In case of buying | in case of selling |
| Entry point | 403 | 376 |
| Target Point 1 (TP1) | First resistance: 412 | First support: 362 |
| Target Point 2 (TP2) | Second resistance: 417 | Second support: 354 |
| Stop Loss (SL) | 376 | 403 |
Through the technical analysis of Tesla stock, it appears that the overall market trend is bearish at the moment, supported by the price trading below the moving averages and negative signals from the MACD indicator. The selling pressure on the stock is expected to continue in the short term, with support levels such as 378 being monitored as potential downside targets.


