
Tesla Stock Technical Analysis: Tesla stock is trading in a downtrend today, recording its highest trading price so far at $303.42, while recording its lowest price at $275.85. Currently, the stock is trading at $284.56, reflecting the continuation of selling pressure on the stock at the present time.
Tesla Stock Technical Analysis: Technical Analysis
By analyzing the price action, we notice that the stock is trading below the moving averages indicators, indicating strong selling pressure and supporting the downtrend hypothesis. This signal indicates that the market currently prefers selling over buying. The MACD indicator also indicates a negative trend, which reinforces the hypothesis that the stock is facing downward momentum in the short and medium term.
Future Outlook:
Since the stock is trading below the moving averages levels and the MACD indicator is showing negative signals, expectations indicate the possibility of continuing the decline towards lower support levels. If the stock breaks the $273.45 level, it could open the door for further declines. On the other hand, if there is any upward bounce, the stock will need to break through major resistance levels to be able to change the trend.
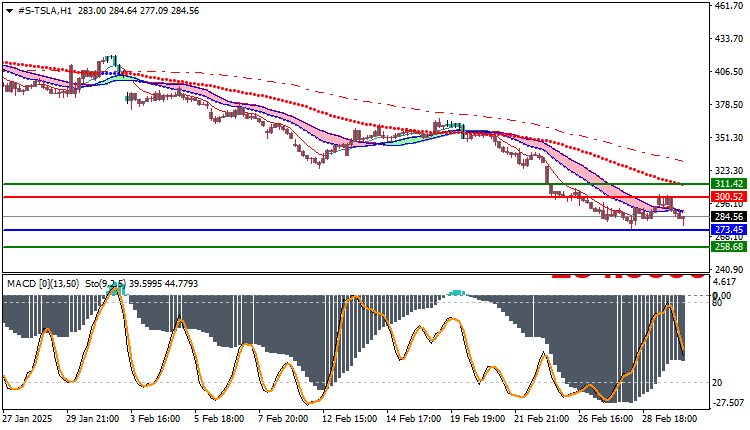
Trading strategies based on Buy/Sell levels
| Tesla Stock | In case of buying | in case of selling |
| Entry point | 300.52 | 273.45 |
| Target Point 1 (TP1) | First resistance: 311.42 | First support: 258.68 |
| Target Point 2 (TP2) | Second resistance: 317.20 | Second support: 252.50 |
| Stop Loss (SL) | 273.45 | 300.52 |
Based on technical analysis, the overall trend of Tesla stock indicates a continued downward trend, supported by negative signals from technical indicators. The market is facing strong selling pressure, which increases the likelihood of continued declines in the near future. Traders are advised to monitor the key support and resistance levels in the stock and make informed decisions based on market developments.


