
Tesla Stock Technical Analysis: Tesla stock is trading in a downtrend today, as technical analysis indicates continued selling pressure on the stock during the current session. Price movements indicate fluctuations between support and resistance levels, with the dominance of the downtrend that is pressuring prices.
Tesla Stock Technical Analysis: Price Analysis
Tesla stock recorded its highest trading price so far at 297.59 and its lowest price at 279.17, and is currently trading at 281.79. This fluctuation in price reflects a state of sideways movement in which prices maintain some downward pressure.
Technical Analysis:
The price is trading below the moving averages, which supports the technical view that the general trend of the stock is down. The MACD indicator also indicates a negative trend, which enhances the possibility of the downtrend continuing in the short term. Trading below the moving averages in this case indicates a weakness in the upward momentum, which makes the downward movement the strongest.
Outlook:
Based on the current situation, Tesla stock is expected to remain in a downtrend if it continues to trade below the moving averages. It is important to watch the 279.17 level as a major support level, as a break of it could reinforce the downward movement towards lower levels. On the other hand, if the stock fails to break this support, we may see some upward movements to test the resistance levels.
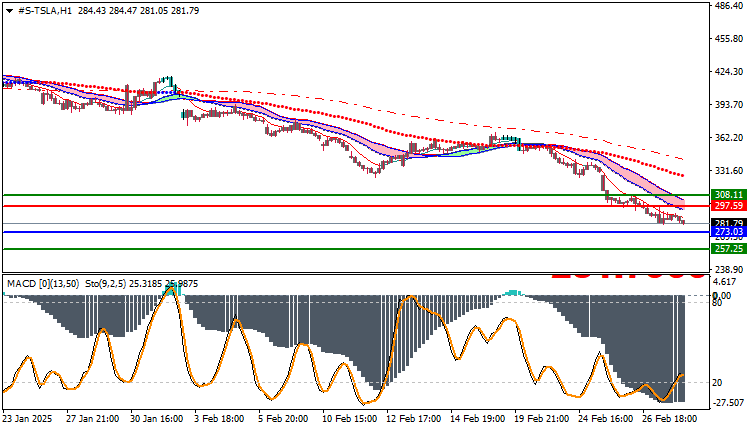
Trading strategies based on Buy/Sell levels
| Tesla Stock | In case of buying | in case of selling |
| Entry point | 297.59 | 273.03 |
| Target Point 1 (TP1) | First resistance: 308.11 | First support: 257.25 |
| Target Point 2 (TP2) | Second resistance: 315.22 | Second support: 248.22 |
| Stop Loss (SL) | 273.03 | 297.59 |
As Tesla continues to trade below the moving averages, the stock is showing a short-term bearish trend. Traders should carefully monitor support and resistance levels, and be prepared for potential moves in case of sudden changes in the trend, especially with negative signals from the MACD indicator.


